


Introduction
Intracranial aneurysm is an abnormal enlargement of a cerebral artery, usually occurring at the arterial bifurcation or circle of Willis [1], and is one of the major diseases affecting 2%–5% of the global population [2–4]. Recently, the widespread use of noninvasive imaging methods such as magnetic resonance imaging has increased the diagnosis of incidentally discovered unruptured intracranial aneurysms (UIAs) [5]. This has led to increased prophylactic endovascular therapy or elective surgical clipping of asymptomatic UIA to prevent subarachnoid hemorrhage (SAH) [6]. However, despite the fact that both surgical and endovascular treatment for UIA carry a risk of up to 5% mortality and morbidity [7], few studies have investigated the predictors and risk factors for bleeding and transfusion during UIA surgery [8], and available information is limited.
The De Ritis ratio is a prognostic biomarker that can be easily calculated by dividing the serum levels of aspartate aminotransferase (AST) by the alanine aminotransferase (ALT) in blood tests [9,10]. The De Ritis ratio is a predictor of survival and complications in patients undergoing some surgeries as well as various cancers [11–13]. Recent studies have reported the relationship between serum aminotransferase (AST and ALT) level and intracerebral hemorrhage (ICH) [14,15], and the De Ritis ratio may be associated with vascular diseases [16,17]. However, to date, no study has reported the association between the De Ritis ratio and incidence of intraoperative transfusion during intracranial aneurysm surgery. Therefore, in this study, we evaluated the correlation between the preoperative De Ritis ratio and the incidence of intraoperative transfusion in patients who underwent surgical clipping of UIA.
Materials and Methods
Study design and population
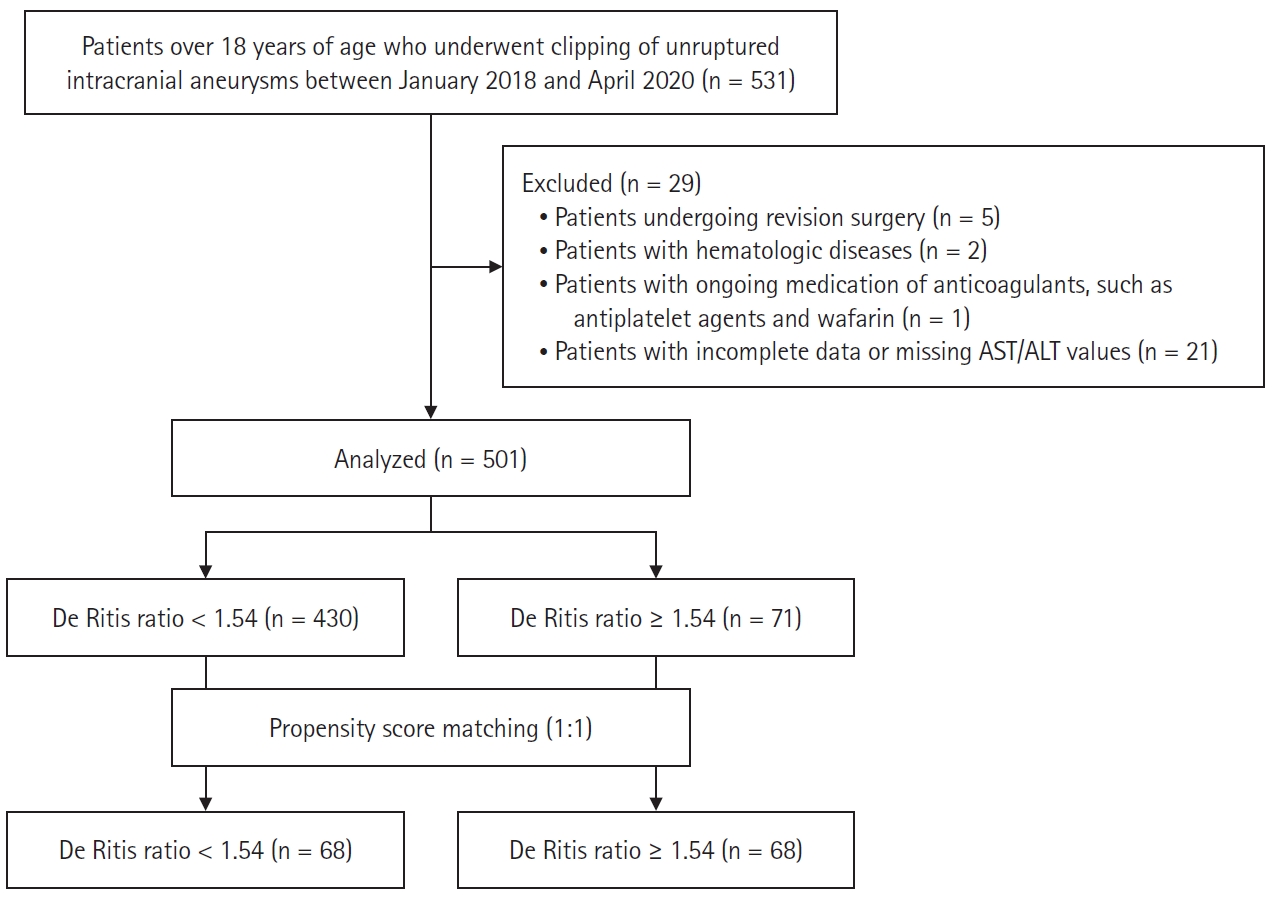
Patients over 18 years of age who underwent surgical clipping of UIAs between January 2018 and April 2020 were enrolled in this study. The Institutional Review Board of Asan Medical Center (Republic of Korea; protocol number: 2022-0755) approved our study, and the need for written informed consent was waived due to its retrospective nature. The exclusion criteria were as follows: patients undergoing revision surgery; patients with hematologic disease; patients with ongoing medication of anticoagulants, such as antiplatelet agents and warfarin; and patients with incomplete data or missing AST/ALT values.
Anesthetic technique
Three anesthesiologists were involved in the anesthesia for neurosurgery during the study period, and they performed as one neuroanesthesia team, with the same anesthesia protocol. For general anesthesia, routine monitors, including noninvasive blood pressure, electrocardiography, and pulse oximetry, were used. Following local infiltration with lidocaine, an arterial catheter was inserted into a radial artery for continuous blood pressure monitoring. For anesthesia induction, 2 mg/kg of propofol and 0.6 mg/kg of rocuronium were administered intravenously. To maintain anesthesia after intubation, propofol and remifentanil were infused using a target-controlled infusion pump (Orchestra®, Fresenius Vial), increasing the effect-site concentration to 2.5–3.0 μg/ml and 10–12 ng/ml, respectively. The Marsh and Minto model were used for target-controlled infusion of propofol and remifentanil, respectively. To prevent hypotension, phenylephrine (0.5–3.0 mg/h) was continuously infused to maintain the mean arterial pressure above 65–70 mmHg. During anesthesia, crystalloid solutions (0.9% normal saline or plasma solution) or colloid solutions (5% albumin) were administered. During surgery, when the plasma hemoglobin (Hb) level reduced to less than 8 g/dl, packed red blood cell (RBC) transfusion was performed, and the Hb level was maintained at more 10 g/dl in patients with coronary artery disease. Hemodynamic instability due to acute massive blood loss was also an indication for transfusion.
Clinical data collection and outcome assessments
Demographic data and pre and intraoperative variables were collected through an electronic medical record system. Demographic and preoperative data included age, height, weight, body mass index (BMI), sex, and aneurysm location and number. Data on comorbid diseases such as diabetes mellitus (DM), hypertension (HTN), cardiovascular disease (CVD), cerebrovascular accident (CVA), and chronic kidney disease (CKD) were also collected.
Laboratory variables included preoperative Hb, platelet count, white blood cell, prothrombin time (PT), activated partial thromboplastin clotting time, RBC distribution width, and creatinine, protein, albumin, blood urea nitrogen, C-reactive protein, AST, ALT, sodium, and potassium levels. All patients’ laboratory blood tests were performed within 14 days prior to surgery. Intraoperative variables included operation time, surgeon who performed the surgery, total crystalloids, urine output, albumin use, mannitol use, RBC transfusion, and RBC unit.
The study outcome was the comparison of the intraoperative transfusion incidence according to the preoperative De Ritis ratio cutoff level (< 1.54 and ≥ 1.54) before and after the propensity score (PS) analysis. Analysis of the risk factors for intraoperative transfusion and evaluation of the association between the preoperative De Ritis ratio and intraoperative transfusion were also the study’s objectives. Additionally, receiver operating characteristic (ROC), net reclassification improvement (NRI), and integrated discrimination improvement (IDI) analysis were employed to evaluate the improvement of model power when adding the De Ritis ratio to the risk model of intraoperative blood transfusion.
Statistical analysis
Data are appropriately presented as means and standard deviations (SDs), median of interquartile ranges, or numbers with ratios. Categorical data was analyzed using the chi-square test or Fisher’s exact test, and continuous data was evaluated using the unpaired t-test or Mann–Whitney U test. To reduce the impact of potential confounders, a PS-matching analysis was performed using 14 variables: age, height, weight, BMI, sex, DM, HTN, CVD, CVA, CKD, Hb level, and aneurysm location, number, and maximum size (Table 1). The criteria for selecting variables for inclusion in the PS model were based on perioperative variables that may influence intraoperative blood transfusion based on the knowledge gained from the existing literature [8,18]. Absolute standardized mean differences were calculated to detect imbalances between the two groups before and after matching. We chose 1:1 PS matching using the nearest neighbor method with a caliper of 0.2. After performing 1:1 PS matching, continuous variables were compared by paired t-test or Wilcoxon signed-rank tests, and categorical variables were compared using the McNemar test. We also used multivariate logistic regression analysis to determine risk factors for intraoperative blood transfusion.
All variables with P values < 0.1 in univariate analysis were included in the multivariate analysis. A ROC curve analysis was used to determine the cutoff value of the De Ritis ratio for intraoperative transfusion. In addition, NRI and IDI analyses were used to evaluate the predictive value of the preoperative De Ritis ratio for intraoperative blood transfusion discrimination. NRI and IDI are statistical methods used to assess the improvement in predictive performance when a novel biomarker is added to a model containing standard biomarkers [19]. Any P value < 0.05 was considered statistically significant. Data manipulation and statistical analysis were performed using IBM SPSS Statistics version 22.0 for Windows (IBM Corp.) and R version 3.1.2 (R Foundation for Statistical Computing).
Results
Of the 530 enrolled patients, 29 were excluded because they did not fulfill the study criteria. Hence, a total of 501 patients were enrolled in this study (Fig. 1).
Table 1 shows the baseline characteristics and perioperative variables of the study population. The mean age and BMI of the patients were 61.5 years and 25.0 kg/m2, respectively, and the majority were women (68.7%). Of the 502 patients, 61 (12.2%) had DM, 300 (59.9%) had HTN, 25 (5.0%) had CVD, 21 (4.2%) had CVA, and 8 (1.6%) had CKD. Most patients belonged to American Society of Anesthesiologists (ASA) class 2 (61.0%) and 3 (38.2%), while five patients belonged to ASA class 4 (0.8%). The middle cerebral arteries were the most common site for aneurysm (41.5%), and the median of the maximum aneurysmal size was 4.5 mm (Table 1). Two surgeons with more than 10 years of experience in neurovascular surgery performed aneurysm clipping during the study period. No significant statistical differences were observed in the De Ritis ratio groups between the two surgeons, even after PS matching. The incidence of intraoperative transfusion was 15.4% (77/502) and the average packed RBC transfusion volume was 1.0 unit in transfused patients. The average packed RBC transfusion volume across all patients was 0.2 unit (Table 1). Intraoperative aneurysm rupture did not occur in any of the cases. After 1:1 PS matching, all baseline characteristics and perioperative variables after matching showed no significant differences between the group with the De Ritis ratio < 1.54 (n = 68) and those with ≥ 1.54 (n = 68) (Table 1).
ROC curve analysis exhibits a preoperative De Ritis ratio cutoff value of 1.54 for intraoperative transfusion (area under the curve [AUC]: 0.661, sensitivity: 36.36%, specificity: 89.86%; Fig. 2). Using the cutoff value, 71 patients (14.2%) were categorized as part of the high De Ritis ratio group; and 430 patients (85.8%) as part of the low De Ritis ratio group (Table 1). Patients in the high De Ritis ratio group were older (P = 0.001), had a lower BMI (P < 0.001), and had a higher proportion of women. (P = 0.016). They also had higher aneurysm numbers (P = 0.026). Concerning laboratory variables, patients in the high De Ritis ratio group had lower Hb (P < 0.001) and platelet levels (P = 0.013) (Table 1).
Study outcomes
After PS-matched analysis, the incidences of intraoperative transfusion (39.7% vs. 16.2%, P = 0.004) and volume of RBC transfusion (0.4 ± 0.6 vs. 0.2 ± 0.4, P = 0.013) were significantly higher in the high De Ritis ratio group than in the low De Ritis group (Table 1).
In the multivariate analysis, the preoperative De Ritis ratio was identified as an independent risk factor for intraoperative transfusion (odds ratio [OR]: 3.04, 95% CI [1.53, 6.03], P = 0.002; Table 2). Additionally, the preoperative Hb value was also a risk factor for intraoperative transfusion (OR: 0.33, 95% CI [0.24, 0.47], P < 0.001; Table 2).
The addition of the De Ritis ratio to the clinical predictive model for intraoperative transfusion, consisting of age, BMI, sex, CVD, preoperative Hb and albumin levels, and PT, showed no significant improvement in the AUC (P = 0.483) but significant improvement in discrimination measured by NRI (0.265, 95% CI [0.024, 0.507], P = 0.031) and IDI (0.027, 95% CI [0.000, 0.055], P = 0.049; Table 3).
Discussion
Our study demonstrated that the preoperative De Ritis ratio was an independent risk factor for intraoperative transfusion in patients who underwent UIA clipping. After scores-matching analysis, a significant difference was observed in the incidence of intraoperative transfusion according to the preoperative De Ritis ratio cutoff level. Additionally, the De Ritis ratio improved the predictive model for intraoperative blood transfusion in NRI and IDI analyses. These results suggest that the preoperative De Ritis ratio, together with previously well-known Hb levels, may be a significant risk factor for intraoperative transfusion in UIA surgery.
Only a few studies report the incidence and risk factors for intraoperative blood transfusion for the clipping of UIA. One study reported an incidence of intraoperative transfusion of 24.5% and identified older age, lower hematocrit level on admission, preoperative aneurysm rupture, severe intraventricular hemorrhage, and larger aneurysm size as preoperative factors associated with intraoperative transfusion [20]. Another study has reported an incidence of intraoperative transfusion of 9.5%, with older age, lower Hb level, large aneurysm size, elevated Hunt-Hess grade, and intraoperative rupture as factors associated with transfusion [8]. In other words, existing studies commonly report age, Hb level, aneurysm size, and aneurysm rupture as factors for intraoperative transfusion. In this study, the incidence of transfusion during UIA clipping was 15.4%, which is consistent with the range of values reported in previous studies. In addition, the preoperative Hb level was observed as a factor associated with transfusion, which is consistent with previous reports. However, aneurysm rupture and size and intraventricular hemorrhage, which have been reported in other studies, were not reported as transfusion-related factors in this study. This could be because the study population was limited to patients with unruptured aneurysms, and the features of the aneurysm itself had less influence on intraoperative bleeding.
One of the distinctive aspects of this study in comparison to previous studies is that it revealed the impact of the De Ritis ratio, the ratio of AST to ALT, on blood transfusion during aneurysm clipping surgery. AST and ALT are enzymes found primarily in the liver cell, but are also found in RBCs, myocardium, and muscle tissue. AST and ALT levels are clinically useful markers for monitoring various liver diseases and conditions [21,22]. The primary reasons for raised transaminase levels are nonalcoholic fatty liver disease and alcoholic liver disease, while less common factors include drug-induced liver injury, hepatitis B and C, hereditary hemochromatosis, and rare causes like alpha1-antitrypsin deficiency, autoimmune hepatitis, and Wilson disease. Additionally, mildly elevated transaminase levels can be linked to extrahepatic sources such as celiac sprue, hemolysis, and thyroid and muscle disorders [23,24].
Although UIA clipping surgeries are increasing with the advancement of imaging techniques, little is known about biomarkers that can predict bleeding and transfusion during UIA clipping surgery. Our study has a clinical value by demonstrating an association between a novel biomarker, the De Ritis ratio, and blood transfusion during UIA clipping surgery. While few studies have shown an association between AST or ALT levels and bleeding, studies linking them to intraoperative bleeding are rare. In a study that analyzed the national health insurance data for more than 100,000 cases, serum aminotransferase level was a significant predictor of ICH [14]. According to another international study on the East Asian population, elevated ALT levels were associated with an increased risk of ICH [15]. Although there is a known correlation between liver dysfunction and bleeding tendencies [25,26], the exact mechanism for the effect of abnormalities in aminotransferase levels on bleeding is not well understood. Along with the abnormalities in coagulation due to the changes in liver function, one can also consider changes in the physical properties of the blood vessels themselves. Brachial-ankle pulse wave velocity, a measure of arterial stiffness, is significantly associated with liver disease and various liver enzymes, particularly AST/ALT [17,27]. Although the exact mechanism by which the De Ritis ratio affects bleeding during aneurysm clipping surgery is unknown, it is believed that it may influence intraoperative blood transfusions through impaired coagulation resulting from liver dysfunction and changes in the physical properties of blood vessels, as described earlier.
There are some limitations to our study. First, due to the retrospective study design, unexpected bias cannot be ruled out, and it may be challenging to determine causality beyond correlations between variables. To overcome the limitations of this retrospective study, we performed PS matching and found that significant differences were observed in the incidence and volume of transfusions between the two groups even after matching. Second, we were unable to provide a precise mechanism for the association that the De Ritis ratio shows with blood transfusion during UIA clipping surgery. Further studies are needed to elucidate this mechanism. Third, to date, no study has accurately reported the cutoff value of the De Ritis ratio for intraoperative transfusion. More well-designed studies are required for accurate validation of the preoperative De Ritis ratio cutoff value that could predict transfusion and surgical outcomes. Fourth, there may have been differences in the determination of transfusion among the anesthesiologists that could cause provider bias, although the anesthesiologists performed as one neuroanesthesia team with no significant difference in practice. Lastly, due to the nature of the surgery itself and the retrospective nature of the study, the exact value of the estimated blood loss was difficult to measure and was excluded as an outcome variable. Future prospective studies on this topic will require accurate measurement and recording of this variable.
In conclusion, the De Ritis ratio might be a significant risk factor for intraoperative blood transfusion in patients undergoing UIA clipping surgery and has the potential to be a useful index for intraoperative anesthetic management in this patient population.