


Introduction
Dexmedetomidine has unique pharmacological effects, including anesthetic-sparing [1,2], postanesthetic recovery–facilitating [3], postoperative delirium–preventing [4], and potent anti-inflammatory effects [1,5]. Dexmedetomidine is often used in combination with other anesthetics, such as propofol, to provide multimodal general anesthesia [6] and improve postoperative recovery [7]. Processed electroencephalogram (EEG) indices such as the bispectral index (BIS), which uses an algorithm to analyze and interpret raw EEG data, are widely used tools for monitoring anesthetic depth [8]; however, processed EEG indices may be unreliable when dexmedetomidine is administered because patients who received dexmedetomidine can present profound slow EEG oscillations (a low BIS score) but remains arousable [8–10].
Recently, we reported that the intraoperative co-administration of dexmedetomidine and propofol combined with goal-directed hemodynamic therapy may have neuroprotective effects, including reducing postoperative neurological complications and preventing postoperative delirium in patients undergoing craniotomy [1]. As a result, we have adopted this regimen as our institutional standard practice for such patients. Furthermore, we observed substantial propofol-sparing effects when dexmedetomidine and propofol were co-administered under the guidance of BIS value [1]. Because each anesthetic produces distinct brain states that are readily visible in an EEG spectrogram and can be easily interpreted by anesthesiologists [8], anesthetic titration based on an EEG spectrogram may provide additional information for anesthetic depth monitoring and may avoid the conventional ‘one-index-fits-all’ approach, which often ignores the influence of anesthetic drug combination [8,11]. Theoretically, the anesthetic exposure in cases that involve the coadministration of dexmedetomidine can be more precise through the use of an EEG spectrogram than the use of BIS value. Therefore, we have changed our institutional anesthetic propofol from BIS guidance to the EEG spectrogram guidance and we hypothesize that propofol consumption during craniotomy with total intravenous anesthesia using dexmedetomidine and propofol would be lower when general anesthesia is guided by EEG spectrogram than when it is guided by BIS values. Based on these context, this retrospective analysis was conducted to test our hypothesis and investigate the potential benefits of EEG spectrogram use on postoperative outcomes.
Materials and Methods
This retrospective observational cohort study was approved by the Research Ethics Committee of National Taiwan University Hospital (approval number: 202211078RINC; approval date: December 8, 2022) and was registered at clinicaltrials.gov (NCT05656547). The requirement for written informed consent was waived by the research ethic committee. Adult patients undergoing elective craniotomy for brain tumor resection, aneurysm clipping, intracranial bypass, or microvascular decompression who received intraoperative EEG spectrogram–guided total intravenous anesthesia with propofol and dexmedetomidine between January 1, 2021, and October 31, 2022, were identified from the institutional database. Identifying information was omitted from the study, thus ensuring patient anonymity. Eighty patients undergoing craniotomy from our previous trial conducted between April 2017 and April 2020 who received intraoperative BIS score guided anesthesia using the same regimens [1], namely propofol and dexmedetomidine were identified as the control cohort for the present study. This study adhered to applicable STROBE guidelines [12].
Anesthesia
The standardized institutional anesthetic protocol for craniotomy involves the administration of total intravenous anesthesia, utilizing a combination of propofol and dexmedetomidine. Prior to 2021, the anesthetic protocol relied on the intraoperative BIS value for management. In contrast, after 2021, the protocol shifted to being guided by the EEG spectrogram. The specific details of these anesthetic protocols are outlined below: A BIS monitor was situated contralateral to the surgical side in an aseptic manner. General anesthesia was performed and maintained by total intravenous anesthesia using a target-controlled infusion of propofol (Schnider model) with an initial dose of effect site concentration with 4.0–5.0 μg/ml during induction. Remifentanil infusion or fentanyl boluses were administrated during surgery at the attending anesthesiologist’s discretion. The muscle relaxant was not added after anesthesia induction to facilitate the neurophysiological monitoring [13]. The attending anesthesiologist titrated the propofol concentration to maintain the targeted anesthetic depth. Patients receiving BIS-guided anesthesia were placed into the index group titrating anesthetics to maintain a BIS value of between 40–60 [1]. Patients receiving EEG spectrogram–guided anesthesia were placed into the spectrogram group. In the EEG spectrogram-guided protocol, the anesthetic depth was managed based on the following principles proposed by our neuroanesthesia team:
(1) Following anesthesia induction and prior to surgical stimulation, the patient's maximal frontal alpha power occurring at the peak of the slow oscillation (referred to as the peak-max state) [14,15] was determined. This period was free of noxious stimuli, and the minimal target-controlled propofol infusion effect site concentration required to maintain the peak-max state was identified as the lower limit of propofol dose titration throughout the surgery (Fig. 1). We inferred that titrating the propofol dosage to maintain robust EEG alpha power as the peak-max state, which is the signature of propofol-based general anesthesia [8] as well as to avoid burst suppression [16].
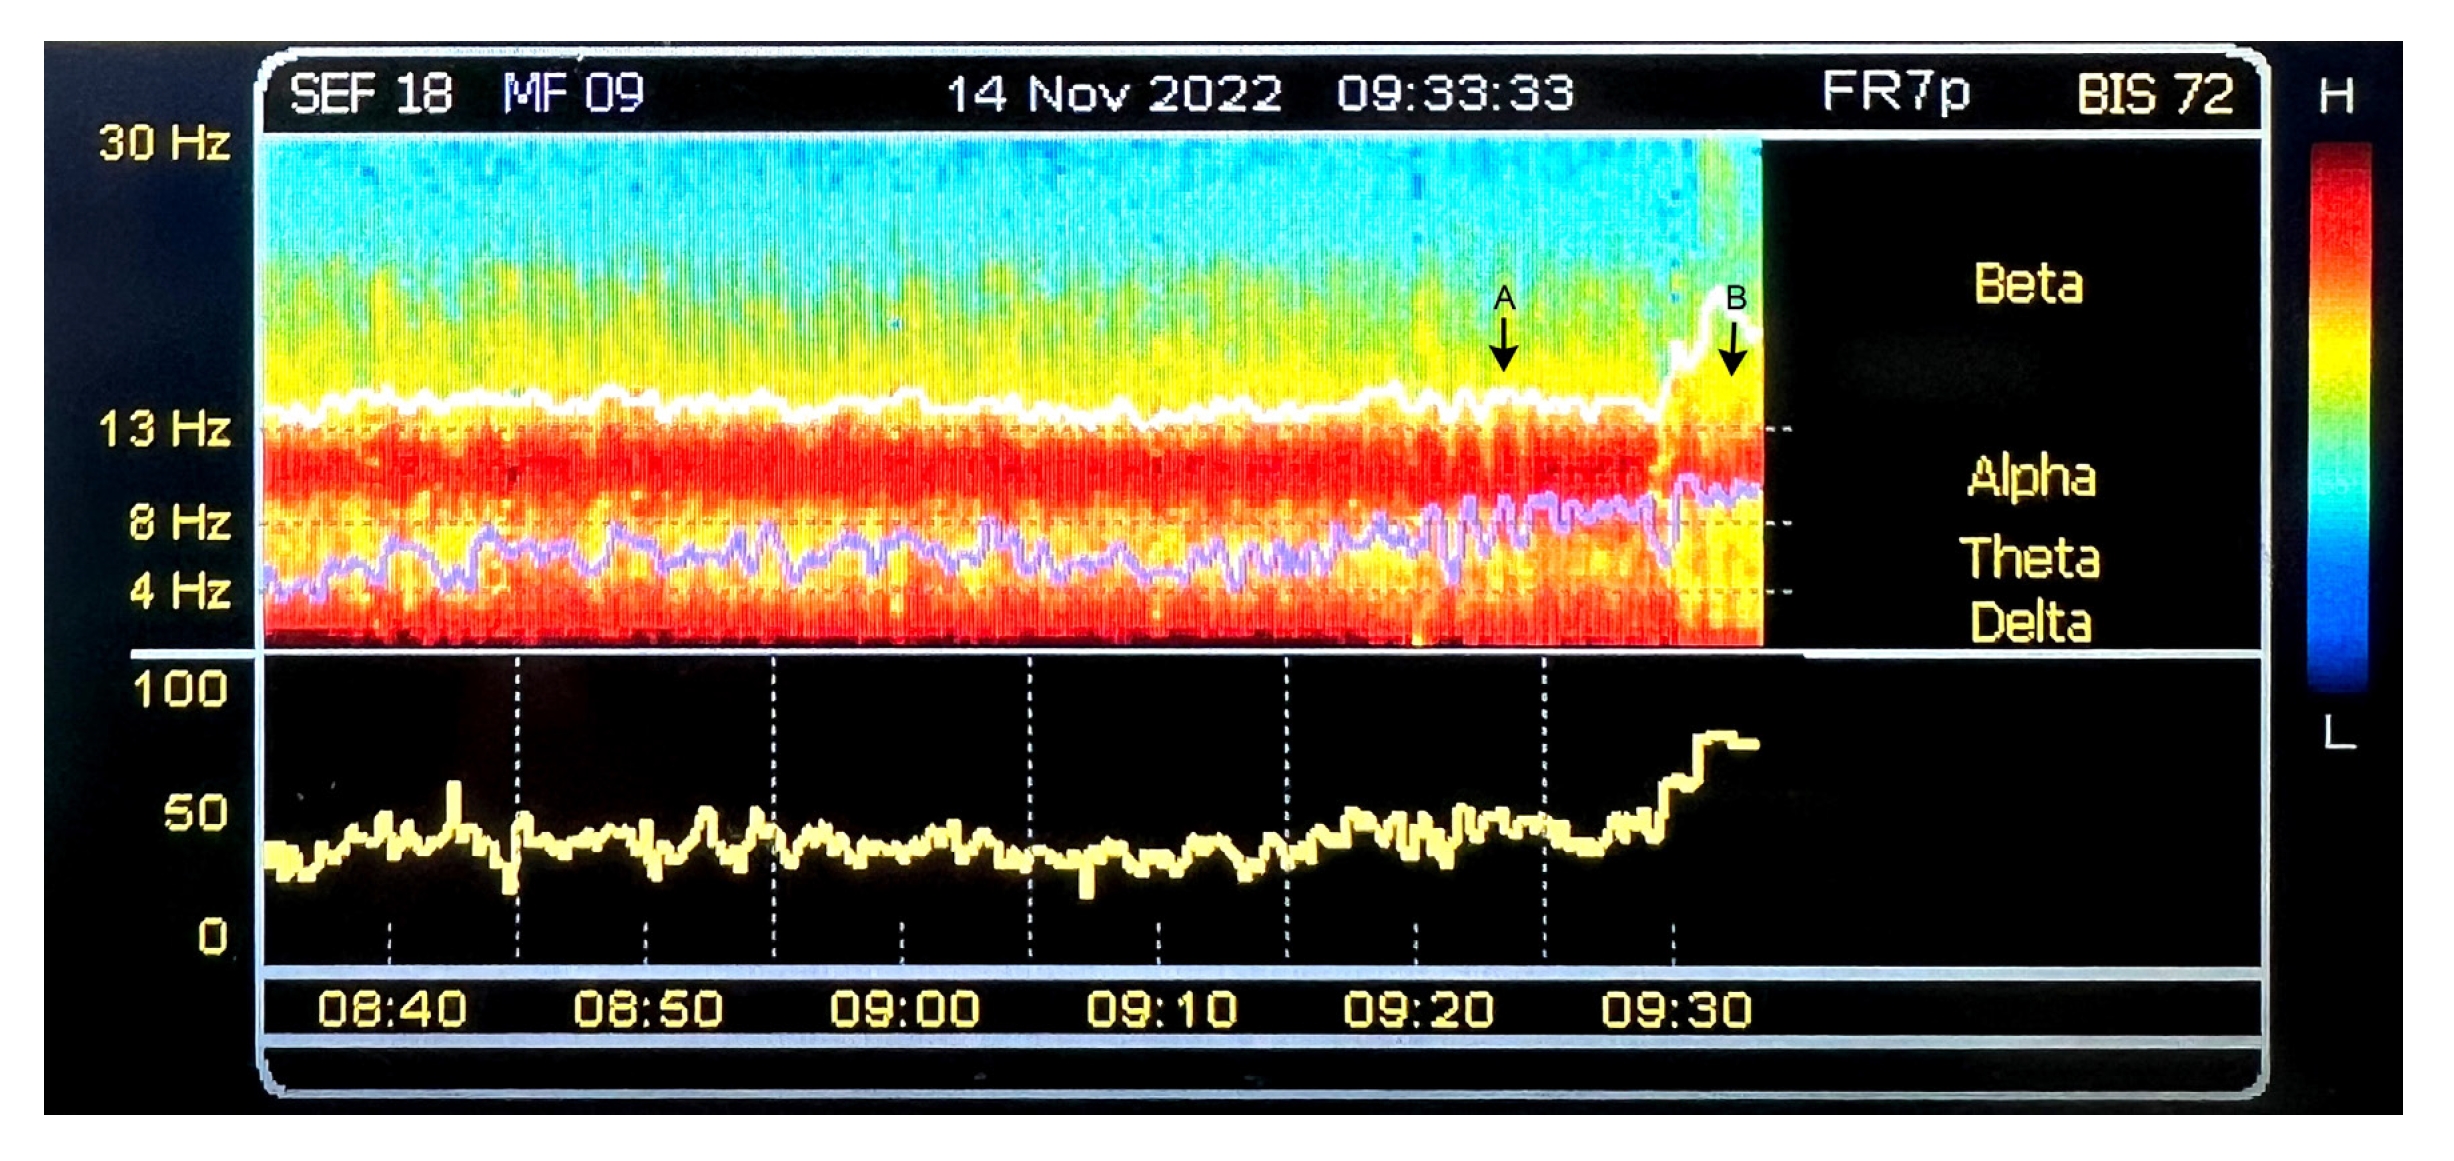
(2) Incremental doses of iv. propofol or remifentanil infusion, as well as additional iv. fentanyl boluses, were administrated to prevent sudden EEG spectrogram patterns coincident with noxious stimuli, namely the beta arousal, delta arousal and alpha dropout [17]. The administration of incremental target-controlled propofol infusion concentration or opioid boluses (Fig. 2) was at the discretion of the attending anesthesiologists, who based their decisions on the principle of differentiating between the loss of peak-max alpha power without obvious sources of noxious stimuli (indicating the need for more propofol) or the alpha dropout combined with beta/delta arousal patterns with obvious sources of increased noxious stimuli (e.g., scalp dissection) or with concurrent hemodynamic changes (indicating the need for more opioid).
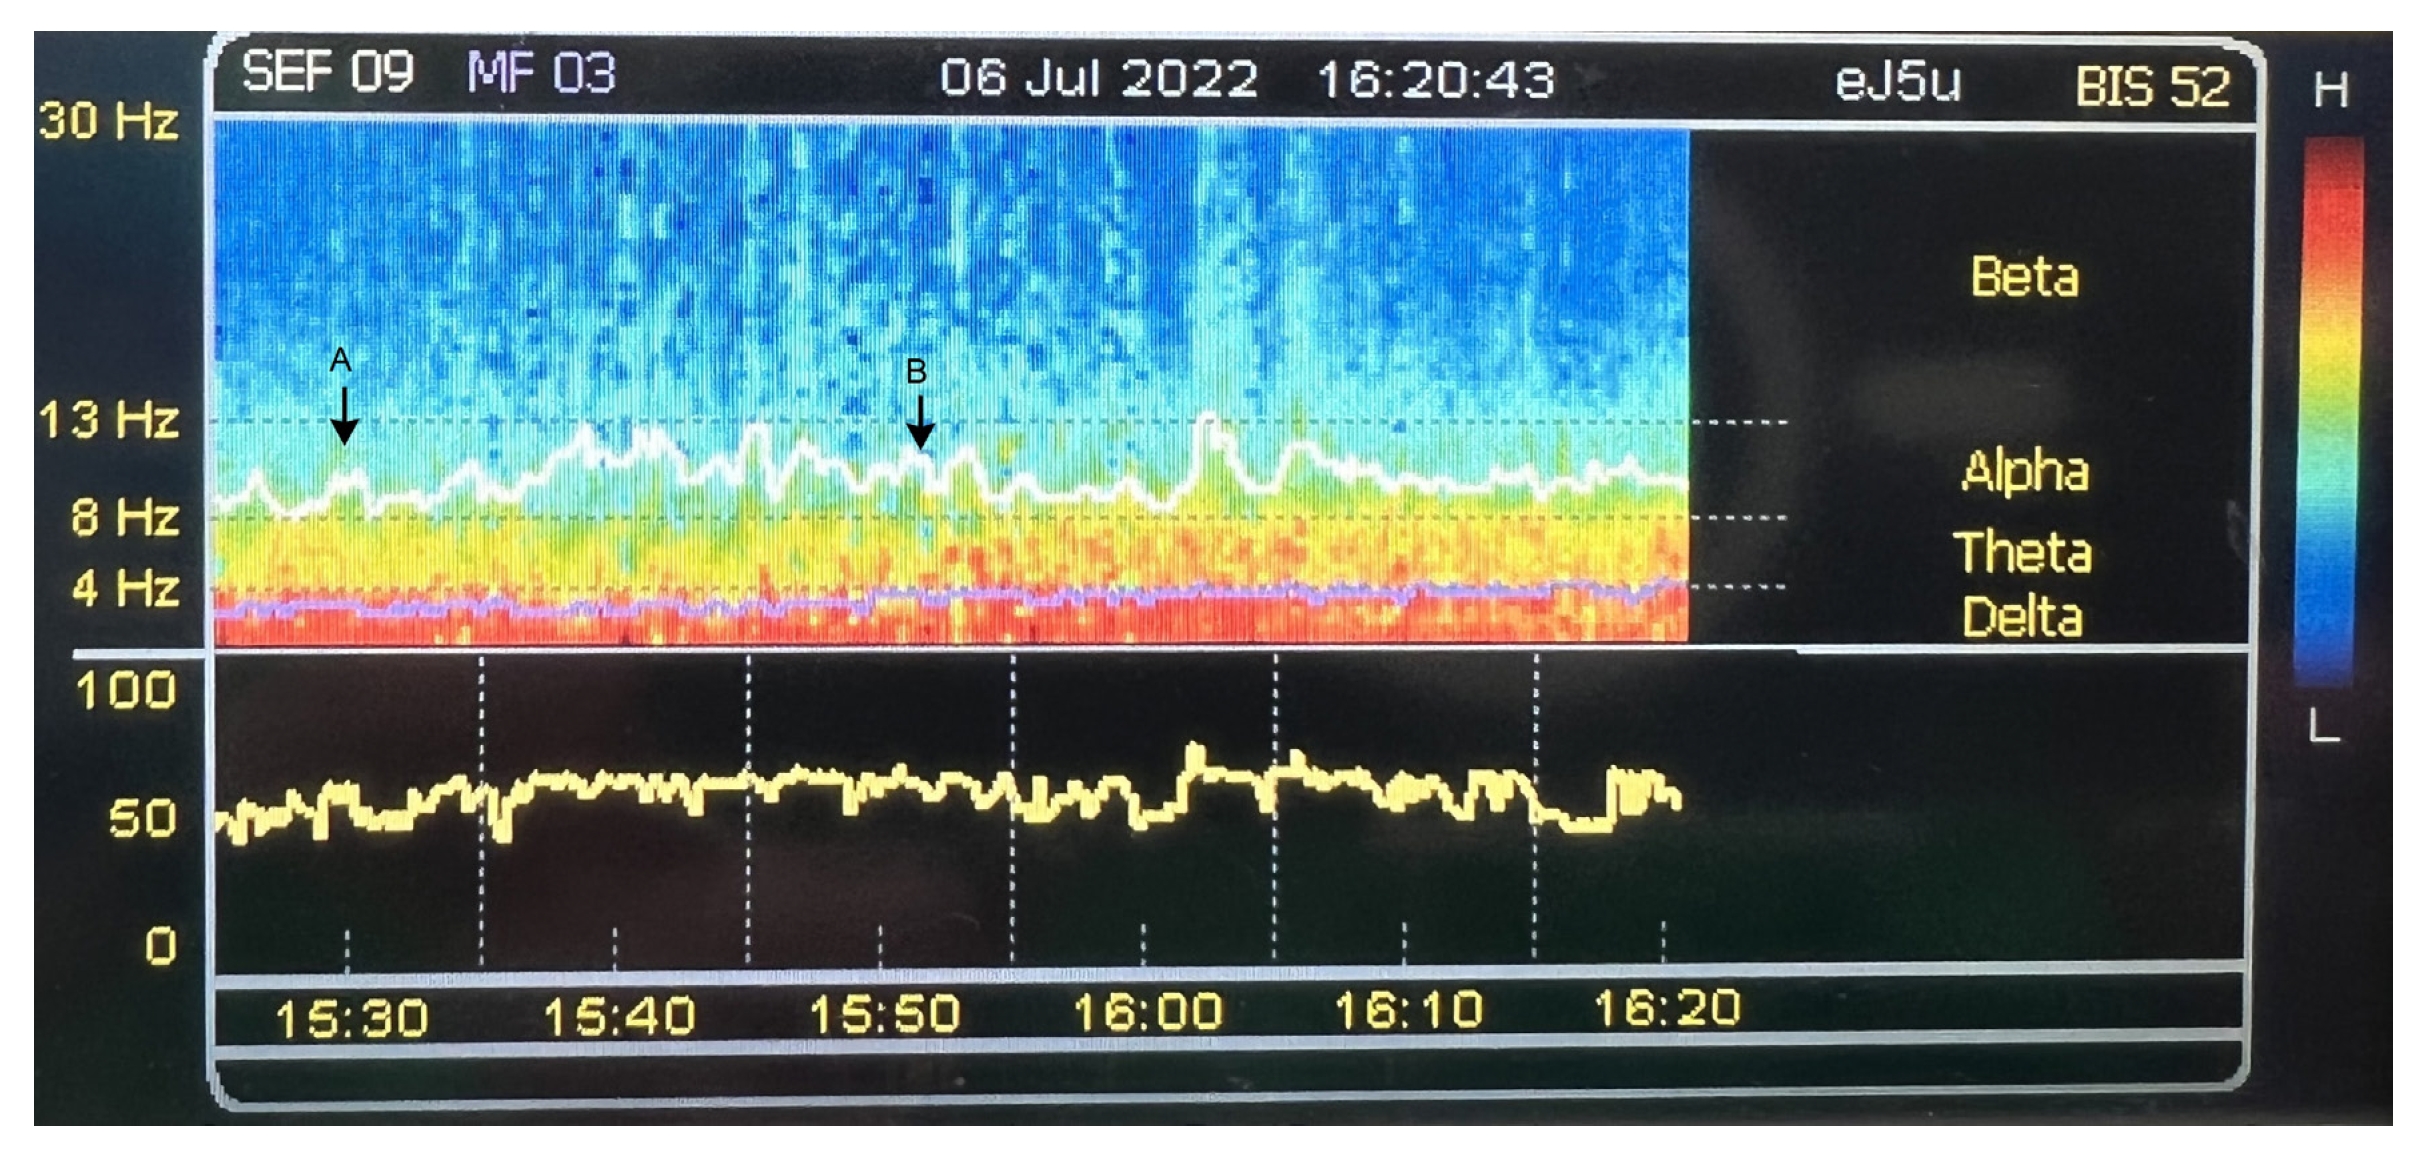
(3) An infusion of dexmedetomidine (0.5 mg/kg/h) was started immediately before anesthesia in each patient. Patients in the index group received a constant rate infusion (0.5 mg/kg/h) of dexmedetomidine [1]. The dexmedetomidine infusion rate was also recommended to maintain the dose of 0.5 mg/kg/h in patients of the spectrogram group as we previously indicated potential neuroprotective effects and anti-inflammatory effects with this therapeutic dose [1,5]. However, because excessive dexmedetomidine may profoundly enhance the effects of propofol anesthesia and may markedly reduce the propofol-induced EEG alpha power [18], the infusion rate may be titrated in patients in the spectrogram group at the attending anesthesiologist’s discretion to maintain robust EEG alpha power and prevent excessively deep anesthesia in cases where the peak-max alpha power was not obtained after titrating down the propofol dose to the lowest acceptable limit (Fig. 3).
For analgesia, each patient routinely received a scalp nerve block containing 10 ml of 0.5% levobupivacaine with a 1:200,000 epinephrine mixture for each side of the scalp before the skin incision [19,20]. Neurophysiological monitoring techniques were used to enhance surgical safety. The fourth-generation Vigileo/FloTrac system (Edwards Lifesciences) was regularly employed to enhance intraoperative cardiac index; this was grounded in our prior positive outcomes with goal-directed fluid therapy for craniotomy [1,21], involving the iterative administration of 250 ml colloid infusions (Voluven® Fresenius Kabi) [1,22].
Postoperative care
After surgery, all patients were immediately transferred to the same neurosurgical intensive care unit (ICU). We characterized “delayed emergence” when the patient’s record revealed the time gap between the end of surgery and the first motor response to command was greater than 30 minutes.
Postoperative neurological complications were identified and characterized through an analysis of medical records. At our institution, specialized neurosurgeons and neurosurgical care-focused nurses conducted patient evaluations a minimum of two times per day. Any newly emerged postoperative neurological symptoms and indicators were diligently recorded. Severe neurological complications were defined to include mortality, intracerebral hemorrhage necessitating surgical intervention, hydrocephalus requiring surgery, a Glasgow Coma Scale score of 13 or lower, failure to successfully transition off mechanical ventilation, and significant motor deficit (indicated by a reduction of at least 2 points in the motor score) [1,23]. The modified Barthel Index was used to assess short-term neurological disabilities [24] which was routinely assessed upon administration and discharge. The occurrence of postoperative delirium was assessed at least twice daily to document any indicative signs in the neurosurgical ICU and ward at out institute. A trained physician, who was unaware of the patient's group allocation, meticulously reviewed the medical records and diagnosed delirium following the criteria outlined in the Intensive Care Delirium Screening Checklist (ICDSC) for the analysis of the present study [25,26].
Statistical analysis
To adjust for selection bias, 1:1 propensity score matching using the nearest neighbor method was performed using a logistic regression model including age, body mass index and surgery type, factors that substantially influence the administration of anesthesia and postoperative neurological outcomes [27,28]. To assess the effects of matching on the improvement of patient allocation balance, we calculated the standardized mean difference (SMD) [29]. Based on the pilot data, which consisted of the first 20 patients who received an EEG spectrogram-guided anesthesia protocol transition at our institute (and were not included in the analysis of the present study), the mean propofol dose was approximately 1800 mg (with a standard deviation of approximately 500 mg). Notably, this was 500 mg lower than the mean propofol dose administered to patients guided by the BIS value in our previous study [1]. A sample size of 60 patients per group is necessary to achieve a power of 0.9 and a two-sided type I error rate of 0.05. Fisher’s exact test or the Χ2 test was performed to analyze dichotomous data, and Student’s t test and the Mann–Whitney U test were used for normally distributed continuous data and nonparametric ordinal data, respectively. Statistical analyses were performed using MedCalc Statistical Software version 20 (MedCalc Software Ltd.).
Results
In total, 98 patients who underwent elective craniotomy with EEG spectrogram–guided anesthesia at our center between January 2021 and October 2022 were enrolled in this study. Combined with the 80 patients in our previous report, a total of 178 patients were included for matching. Propensity score matching, in which the patients were matched 1:1 by age and operation time, yielded 70 patients in the spectrogram group and 70 patients in the index group. Patient characteristics before and after matching are summarized in Table 1. Following the matching process, the SMDs of the majority of baseline characteristics were reduced. Notably, the SMD of body mass index, which is a major factor influencing the intraoperative propofol dose, between the two study groups was significantly reduced, from 0.26 to 0.02.
Intraoperative profiles
The intraoperative profiles of the two groups are summarized in Table 2. The two groups had comparable operation times, blood loss, and transfusion profiles. Patients in the spectrogram group received significantly less propofol than did those in the index group (1585 ± 581 vs. 2314 ± 810 mg, respectively, P < 0.001; Table 2). Patients in the index group received 0.5 μg/kg/h of dexmedetomidine, whereas patients in the spectrogram group received 0.40 ± 0.11 μg/kg/h. The median (Q1, Q3) intraoperative BIS values were higher in the spectrogram group than in the index group [44 (41, 49) vs. 41 (37, 45), respectively, P < 0.001; Table 2]. No significant differences in fentanyl equivalent doses were observed between the two groups (Table 2).
Average intraoperative cardiac index, mean arterial pressure, and crystalloid solution volume values were similar between the groups (Table 2). By comparison, patients in the spectrogram group revealed a significant lower intraoperative heart rate (P = 0.028). Intraoperative norepinephrine doses were not significantly different between the study groups (8.7± 16.1 vs. 4.4 ± 16.4 μg in the spectrogram and index groups, respectively, P = 0.117; Table 2). Patients in the spectrogram group received significantly less nicardipine than did patients in the index group (median [Q1, Q3]; 0 [0, 0.7] vs. 2.0 [0.3, 5.5] mg, respectively, P < 0.001; Table 2). Patients in the spectrogram group received significantly less colloid than did patients in the index group (405 ± 340 vs. 659 ± 350 ml, respectively, P < 0.001; Table 2) and had a smaller median (Q1, Q3). intraoperative urine output (800 [400, 1200] vs. 1200 [800, 1825] ml, respectively, P < 0.001; Table 2).
Postoperative outcomes
Postoperative outcomes for each group are summarized in Table 3. The median (Q1, Q3) number of days in hospital was 8 (6, 10) in the spectrum group versus 9 (6, 14) in the index group (P = 0.098; Table 2). The number of days in the ICU was similar between the groups. The incidence of postoperative neurological complications was similar between the groups.
The percentage of patients with delayed emergence was lower in the spectrogram group than in the index group (1.4% vs. 11.4%, P = 0.033; Table 3). Regarding postoperative delirium, one patient in the spectrogram group and two patients in the index group could not be assessed because they were comatose. The two groups had comparable postoperative delirium profiles. In total, 2 patients in the spectrogram group and 4 patients in the index group had an ICDSC score ≥4 (delirium), and 64 and 58 patients in the spectrogram and index groups, respectively, had an ICDSC score of 0 (P = 0.227). The in-hospital Barthel's index scores showed more favorable changes in the spectrum group compared to the index group. Specifically, at admission, the scores were 83.6 ± 27.6 in the spectrum group and 91.6 ± 17.1 in the index group. At discharge, the scores were 86.4 ± 24.3 in the spectrum group and 85.1 ± 21.5 in the index group. The group-time interaction analysis revealed a significant difference between the two groups (P = 0.008; Table 3).
Discussion
In the present study, we observed that anesthetic doses were markedly lower in patients receiving EEG spectrogram–guided anesthesia than in those receiving BIS value–guided anesthesia. The reduced anesthetic dose appears to correlate with a lower incidence of delayed emergence and higher Barthel index scores at discharge and may reduce postoperative subsyndromal delirium.
Coadministration of dexmedetomidine is effective in lowering propofol requirements for total intravenous anesthesia [30]. Accordingly, our previous study indicated that the coadministration of dexmedetomidine led to a propofol dose reduction of approximately 20% based on BIS value–guided anesthesia [1]. Furthermore, the scalp block was applied in each patient and this markedly reduced anesthetic requirement [31]. The present study indicates that an EEG spectrogram–guided anesthetic protocol elicits additional propofol-sparing effects (approximately overall 31.5%) compared with a BIS value–guided anesthetic protocol. The median averaged BIS values in the spectrum group were maintained only 10% higher than the average value maintained in the index group. Several factors may cause erroneous BIS scores and the large differences in anesthetic doses. First, electromyographic artefacts resulting from electrocautery at the surgical site and cranial nerve stimulator may cause transient increase BIS index values (we provided an example in the Supplementary Fig. 1) [32,33]. Second, dexmedetomidine may also affect BIS values. Kasuya et al. [34] observed lower BIS values at a given observational sedation level in volunteers sedated with dexmedetomidine than in those sedated with propofol. Similarly, Xi et al. [35] observed lower BIS values in patients sedated with dexmedetomidine than in those sedated with propofol at moderate and deep sedation levels. Dexmedetomidine may induce slow EEG oscillations, thereby reducing BIS values at a given sedation level. This may explain why BIS values for both groups in the present study were relatively low. In addition, we observed that the range of the average BIS values was wider in the spectrogram group compared to the index group, with values ranging from 27 to 72 in the spectrogram group and 31 to 56 in the index group. Furthermore, it's important to note that the averaged BIS value was calculated in 5-minute intervals from the electronic medical records, rather than being an average of continuous data. As a result, the BIS data provided in the present study may potentially underestimate the true difference between spectrogram-guided anesthesia and index-guided anesthesia. This finding highlighted that by monitoring the EEG spectrogram, anesthesiologists may not strictly adhere to maintaining the BIS value within the common recommended 40–60 range and this approach of using EEG spectrogram guidance appears to be effective in reducing unnecessary intraoperative anesthetic requirements during craniotomy.
In addition, propofol doses varied less in the spectrogram group than in the index group, suggesting that EEG spectrogram–guided anesthesia facilitated a more accurate propofol titration than did BIS value–guided anesthesia. The anesthetic-sparing effect of EEG spectrogram–guided anesthesia was also observed in a trial involving children by Long et al. [36], in which the EEG spectrogram–guided protocol required 10% less sevoflurane than did the standard care protocol. The anesthetic-sparing effect is more prominent in our study than in that by Long et al., possibly because the present study coadministered two hypnotic agents, whereas only one hypnotic agent, sevoflurane, was administered in the study by Long et al. This emphasizes the necessity of having an EEG spectrogram available in the context of multimodal general anesthesia [6].
In the present study, we observed several favorable postoperative outcomes, including the prevention of delayed emergence, better Barthel index scores, and prevention of subsyndromal delirium among patients in the spectrogram group. Dutta et al. [30] reported that the administration of dexmedetomidine in combination with propofol in BIS value–guided anesthesia significantly reduced the propofol requirement but increased the risk of early postoperative sedation. In the present study, patients receiving EEG spectrogram–guided anesthesia were less likely to experience delayed emergence than were those receiving BIS value–guided anesthesia, possibly because of the reduced propofol dose. The prevention of delayed emergence is crucial for patients undergoing craniotomy for early neurological assessment and immediate optimization of treatment after surgery. This may contribute to the better in-hospital Barthel index change in the spectrogram group.
The use of processed EEG indices monitor aims to precisely control the anesthetic depth and this often is related with a reduction of anesthetic dosage in real world practice [37,38]. Furthermore, there is a great interest of application of the EEG monitoring to prevent postoperative delirium [39]. However, one of the current landmark trial, namely the ENGAGE trial, revealed that use of BIS value to guide anesthesia reduces intraoperative anesthetic consumption by up to 0.11 minimum alveolar concentration but does not prevent postoperative delirium [40]. In the postoperative delirium substudy of BALANCE trial, the postoperative delirium incidence was lower among patients received a lighter anesthesia (BIS 50) than those received a deeper anesthesia (BIS 35) [41]. Although the spectrum group received substantially less (35%) propofol than did the index group, the incidence of postoperative delirium was the same for both groups. Patients undergoing craniotomy may be more susceptible to postoperative delirium than patients undergoing other types of surgery because craniotomy causes cerebral injuries such as neuroinflammation, focal tissue ischemia, and tissue edema [42,43]. Therefore, a reduction in anesthesia alone is not sufficient to prevent delirium after craniotomy. However, no patient in the spectrogram group and five patients in the index group (0% vs. 7.4%) had subsyndromal delirium (ICDSC score of 1–3). Intraoperative low frontal EEG alpha power is associated with postoperative subsyndromal delirium [44] and propofol reduces EEG alpha power [45]. Therefore, propofol dose may be correlated with the incidence of subsyndromal delirium. As postoperative subsyndromal delirium prognosticates poor outcomes [46], an EEG spectrogram–guided anesthetic protocol may be beneficial to prevent this complication for patients undergoing craniotomy. However, we observed no significant differences in postoperative neurological complication between the two groups because neurological complications in patients undergoing craniotomy are more likely to be related with the surgery than the anesthesia.
Regarding the intraoperative hemodynamic profiles, patients in the spectrogram group required less colloid to maintain intraoperative cardiac output than did those in the index group, possibly because the spectrum group received less propofol. As the propofol concentration increases, the mean systemic filling pressure increases [47], and the venous return decreases [48] which requires amount of intravenous fluid required to maintain cardiac output. However, intraoperative fluid requirement may be related with more complex interactions between hemodynamic Dexmedetomidine induces biphasic changes in arterial pressure with both hypertensive and hypotensive effects; a high maintenance dose may induce higher arterial pressure than a low maintenance dose [49]. Patients in the spectrogram group received a smaller maintenance dose of dexmedetomidine than did those in the index group and therefore required less intraoperative nicardipine than did patients in the index group.
This study has several limitations. First, maintaining the alpha power was a qualitative rather than a quantitative goal and the values of alpha power was not allowable to be exported from the EEG device. Therefore, it is unable to compare the alpha power between the two study groups. Furthermore, despite the proposal of the EEG spectrogram-guided protocol, calculating the actual protocol compliance was challenging due to the retrospective design. Second, there is an age-dependent decline in alpha power of the EEG. As the average age of our cohort was below 60 years old, our protocol and results should not be completely extrapolated to the geriatric population. Third, intraoperative nociception may not be optimally monitored by the combination of EEG spectrogram and hemodynamic changes [17], and thus we considered the implication of scalp block crucial in our protocol to reduce inadequate nociception control. Hence, our protocol may not be suitable for patients who did not receive a scalp block. Forth, we did not have sufficient resources to save the details of EEG data. Relevant parameters, such as the intraoperative burst suppression time, were not available. However, because the spectrogram group received less propofol, we assumed that the spectrogram group had a lower accumulated suppression time than did the index group. Fifth, he primary outcome of the present study is propofol consumption. Secondary outcomes, including the incidence of postoperative delirium and the length of hospital stay, were not sufficiently powered to detect significant differences. Furthermore, the retrospective design may increase the risk of unexplored factors influencing outcomes other than the anesthetic consumptions such as the differences in the Barthel indices as well as the differences in intraoperative iv. fluid requirements. Sixth, the surgical type was not optimally balanced between the two study groups. For instance, there were more patients undergoing aneurysm clipping in our previous trial (index group) than in the spectrogram group. This difference may be attributed to the growing trend towards using endovascular coiling instead of surgical clipping for the treatment of unruptured cerebral aneurysms in recent years [50]. Consequently, fewer patients in the spectrogram group (where surgery was performed in a more recent period) underwent aneurysm clipping. Furthermore, electroencephalographic spectrogram-guided anesthesia is a relatively new clinical practice, resulting in a relatively small number of patients in the spectrogram database at our institute, making it challenging to achieve optimal matching. Despite these challenges, the SMD of the surgical type still decreased after the matching process. The primary outcome, namely the propofol dose, was more closely related to age and body mass index than the surgical type [27,28], and the SMDs of age and body mass index were below 0.1, indicating good balanced matching [29].
In conclusion, this study demonstrated that for patients undergoing craniotomy and receiving total intravenous anesthesia using dexmedetomidine and propofol, less propofol is required when anesthesia administration is guided by an EEG spectrogram than when it is guided by a BIS monitor. Precise anesthetic dosing may also prevent delayed emergence, improve postoperative Barthel index scores, and reduce intraoperative fluid requirements.