Korean J Anesthesiol Search

CLOSE


Korean J Anesthesiol > Volume 76(6); 2023 > Article
Oh, Park, Lee, Yang, Ahn, Lee, and Lee: Association between inflammation-based prognostic markers and mortality of non-cardiac surgery

Abstract

Background

To evaluate the association between inflammation and nutrition-based biomarkers and postoperative outcomes after non-cardiac surgery.

Methods

Between January 2011 and June 2019, a total of 102,052 patients undergoing non-cardiac surgery were evaluated, with C-reactive protein (CRP), albumin, and complete blood count measured within six months before surgery. We assessed their CRP-to-albumin ratio (CAR), neutrophil-to-lymphocyte ratio (NLR), platelet-to-lymphocyte ratio (PLR), and modified Glasgow Prognostic Score (mGPS). We determined the best cut-off values by using the receiver operating characteristic (ROC) curves. Patients were divided into high and low groups according to the estimated threshold, and we compared the one-year mortality.

Results

The one-year mortality of the entire sample was 4.2%. ROC analysis revealed areas under the curve of 0.796, 0.743, 0.670, and 0.708 for CAR, NLR, PLR, and mGPS, respectively. According to the estimated threshold, high CAR, NLR, PLR, and mGPS were associated with increased one-year mortality (1.7% vs. 11.7%, hazard ratio [HR]: 2.38, 95% CI [2.05, 2.76], P < 0.001 for CAR; 2.2% vs. 10.3%, HR: 1.81, 95% CI [1.62, 2.03], P < 0.001 for NLR; 2.6% vs. 10.5%, HR: 1.86, 95% CI [1.73, 2.01], P < 0.001 for PLR; and 2.3% vs. 16.3%, HR: 2.37, 95% CI [2.07, 2.72], P < 0.001 for mGPS).

Conclusions

Preoperative CAR, NRL, PLR, and mGPS were associated with postoperative mortality. Our findings may be helpful in predicting mortality after non-cardiac surgery.

Introduction

The number of major non-cardiac surgeries performed annually is now over 300 million cases, and they are frequently recommended for older patients in more comorbid populations due to advancements in surgical techniques and perioperative care [1]. Postoperative mortality imposes one of the largest mortality cause in developed countries [2], and perioperative care remains challenging because of the additive effects of metabolic burden from surgical stress and the frailty of patients. Therefore, it is difficult for a single biomarker to adequately reflect perioperative risk.
Recently, increasing evidence has indicated that combining various markers of systemic inflammatory response or nutritional condition could better reflect clinical prognosis [317]. A number of combinations using inflammation-based and nutritional biomarkers such as C-reactive protein (CRP)-to-albumin ratio (CAR) [10,16,17], neutrophil-to-lymphocyte ratio (NLR) [11], platelet-to-lymphocyte ratio (PLR) [12], and modified Glasgow Prognostic Score (mGPS) [13] have been proposed to reflect poor prognosis at higher levels. The strength of these indicators is that they can be simply calculated using readily available blood laboratory tests and have been widely investigated as reliable prognostic biomarkers. However, previous studies have tended to be conducted dominantly among critical patients or those with cancer, resulting in a paucity of data for the general surgical population. Therefore, this study used a large cohort of consecutive patients undergoing non-cardiac surgery and aimed to evaluate whether CAR, NLR, PLR, and mGPS are associated with postoperative mortality. Our findings may be helpful for clinicians to distinguish an accurate prognosis index and to provide individualized therapy in relevant fields.

Materials and Methods

The Institutional Review Board (IRB) of our institution approved this study and waived the need for written informed consent because we used a de-identified registry (IRB no. 2021-06-078). The study was conducted following the Declaration of Helsinki-2013, and we reported the result in accordance with the Strengthening the Reporting of Observational Studies in Epidemiology guidelines.

Data curation & study population

This study analyzed the data from our NoCop (Non-Cardiac Operation, KCT 0006363) registry that contains data of 203,787 consecutive adult patients who underwent non-cardiac surgery in our institution between January 2011 and June 2019. We generated this large, single-center, de-identified cohort by extracting data from the institutional electronic archive system. Our institutional electronic archive system provides an electronic system that allows researchers to retrieve data from electronic medical records in a de-identified form and is known as “Clinical Data Warehouse Darwin-C.” This system can extract medical records of more than four million patients with more than 900 million laboratory findings and 200 million prescriptions. It also provides data on mortality outside the institution, updated from the National Population Registry of the Korea National Statistical Office using a unique personal identification number. Based on an extracted preoperative evaluation sheet, investigators who were blinded to mortality collected relevant preoperative variables, including demographic data and underlying diseases. In our institution, the preoperative evaluation sheet is generated one day prior to surgery and contains the most recent laboratory test results obtained within six months prior to surgery. So, we used the most recent results available within six months before surgery for blood laboratory tests of CRP, albumin, and complete blood count (CBC) that were automatically extracted from the electronic medical records system.

Study endpoints & definitions

The primary endpoint was mortality during the one-year follow-up after surgery. The secondary endpoint was mortality during three-year follow-up.
The mGPS was calculated from baseline CRP and albumin as follows: score 0; CRP ≤ 10 mg/L, score 1; CRP > 10 mg/L and albumin ≥3.5 g/dl, and score 2; CRP > 10 mg/L and albumin < 3.5 g/dl [13]. The other prognostic indicators were determined using the following formula: (1) NLR = absolute neutrophil count/absolute lymphocyte count; (2) PLR = absolute platelet count/absolute lymphocyte count; (3) CAR = CRP/albumin [18].

Statistical analysis

The categorical variables were presented as numbers with percentages, and continuous variables were expressed as mean ± standard deviation or median with median (Q1, Q3) as appropriate. The categorical variables were compared using the Chi-square test, and continuous variables were compared using the t-test or the Mann-Whitney test. To estimate the optimal cut-off value of CAR, NLR, and PLR associated with one-year mortality, receiver operating characteristic (ROC) curve analysis was performed, and Youden’s index was calculated. The cut-off values were determined based on the point on the ROC curve that maximized the sum of sensitivity and specificity, as indicated by Youden’s index, with values above this indicating a higher risk of one-year mortality. So, these cut-off values were chosen based on their ability to distinguish between patients with a higher or lower risk of one-year mortality. The preoperative mGPS score was divided into three groups (0, 1, and 2), and 0 was selected as the cut-off value [3,5]. Based on the estimated cut-off value, patients were classified into low and high groups, and their mortalities were compared using the Cox regression analysis. The results were reported as hazard ratio (HR) with 95% CI. To reduce bias and achieve a balance between the groups, we conducted adjustments with inverse probability weighting (IPW) using the propensity score for all relevant variables [19]. Through this method, weights for patients with higher values were the inverse of the propensity score, and weights for patients with lower values and standardized mean difference less than 10% were considered balance between the groups. In addition, we performed a sensitivity analysis by conducting subgroup analysis for postoperative treatment such as postoperative intensive care treatment, transfusion, and dialysis, as these factors could also affect mortality. Kaplan-Meier curves were generated for mortalities and compared with the log-rank tests. Based on the sample size, the power of our analysis was 0.99 when the HR was greater than 1.1 [20]. All statistical analysis in this study was performed by R 4.2.0 (Vienna, Austria; http://www.R-project.org/). All tests were two-tailed, and a P value less than 0.05 was considered statistically significant.

Results

This study demonstrated the associations between preoperative inflammatory and nutrition-based markers and mortality after non-cardiac surgery. From a total of 203,787 patients in the SMC-NoCop registry, we excluded 101,735 without fully available CRP, albumin, and CBC results six months before surgery. Finally, 102,052 (50.1%) patients were enrolled for analysis. The baseline characteristics of the patients according to one-year mortality are summarized in Table 1. The median durations from blood laboratory tests to surgery were 11.5 (median 1.7, 23.4) days for CAR and 10.3 (median 1.4, 21.3) for complete blood cell counts that were used to estimate NLR and PLR. Of the 102,052 patients, there were 4,240 (4.2%) who exhibited one-year mortality. These patients were older, male dominant, and had a higher prevalence of most comorbidities. They also experienced more emergencies and underwent intermediate to high-risk surgeries. Preoperative median values of CAR, NLR, PLR, and number of patients with mGPS > 0 were higher in patients with one-year mortality.
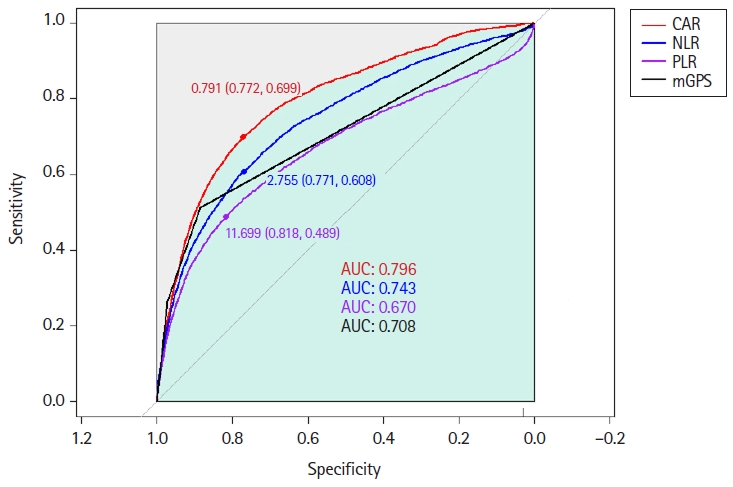
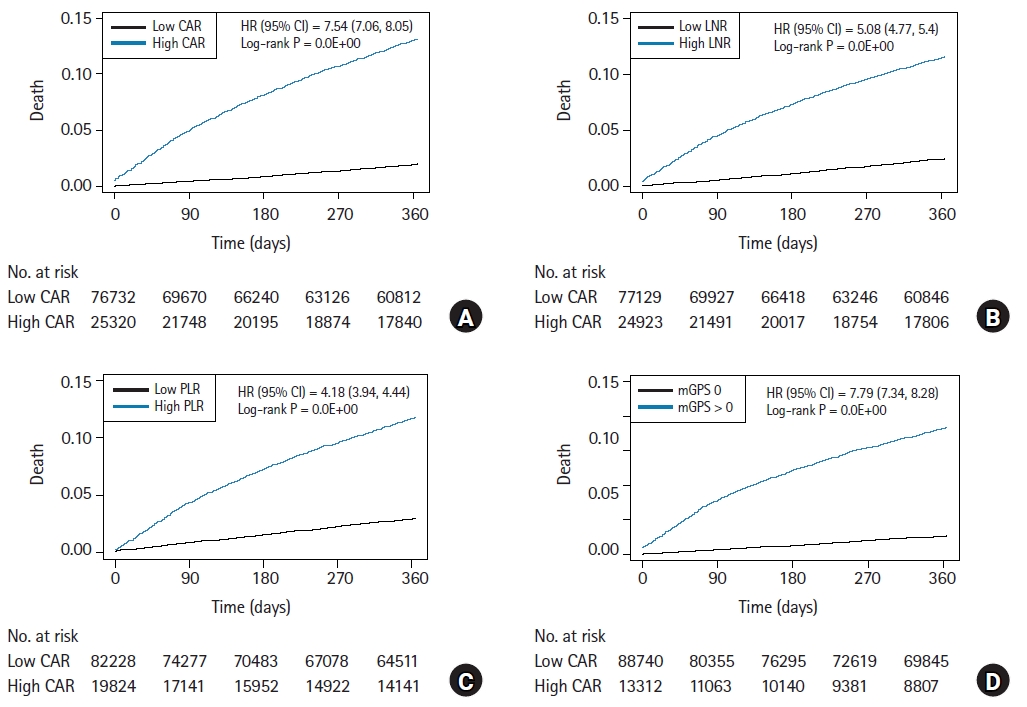
We generated the ROC curve for each index, and the area under the curve of CAR, NLR, PLR, and mGPS were 0.796, 0.743, 0.670, and 0.708, respectively (Fig. 1). Based on the maximum Youden’s index, the optimal cut-off threshold values of CAR, NLR, and PLR were 0.76, 2.78, and 11.70 for one-year mortality, respectively. According to these calculated cut-off values, patients were classified into low and high groups: 76,732 (75.2%) vs. 25,320 (24.5%) for CAR; 77,129 (75.6%) vs. 24,923 (24.4%) for NLR; 82,228 (80.6%) vs. 19,824 (19.4%) for PLR; and 88,740 (87.0%) vs. 13,312 (13.0%) for mGPS (0 vs. 1–2). The baseline characteristics are compared according to these values in Supplementary Tables 14. In all types of inflammatory indices, the high groups exhibited higher values and greater incidence of relevant risk factors. The Kaplan-Meier curves displaying survival rates at one-year after surgery according to inflammatory index are shown in Fig. 2. After an adjustment for the IPW technique, high CAR, NLR, PLR, and mGPS groups were significantly associated with increased risk of one-year mortality (1.7% vs. 11.7%, HR: 2.38, 95% CI [2.05, 2.76], P < 0.001 for CAR; 2.2% vs. 10.3%, HR: 1.81, 95% CI [1.62, 2.03], P < 0.001 for NLR; 2.6% vs. 10.5%, HR: 1.86; 95% CI [1.73, 2.01], P < 0.001 for PLR; and 2.3% vs. 16.3%, HR: 2.37, 95% CI [2.07, 2.72], P < 0.001 for mGPS) (Table 2). This relationship persisted for three-year mortality (4.2% vs. 18.9%, HR: 2.15, 95% CI [1.97, 2.34], P < 0.001 for CAR; 5.1% vs. 16.3%, HR: 1.71, 95% CI [1.60, 1.84], P < 0.001 for NLR; 5.7% vs. 17.0%, HR: 1.81, 95% CI [1.72, 1.92], P < 0.001 for PLR; and 5.4% vs. 24.2%, HR: 2.11, 95% CI [1.92, 2.32], P < 0.001 for mGPS). In subgroup analysis, we did not observe a significant interaction for the association between mortality and the estimated threshold of each index (Table 3).

Discussion

This study demonstrated an association between preoperative CAR, PLR, NLR, and mGPS and postoperative mortality after non-cardiac surgery. Patients with higher values than the estimated thresholds exhibited an increased risk of mortality after statistical adjustment. These indicators showed a fair ability to predict postoperative one-year mortality, and CAR showed the best predictive performance.
Inflammation and nutritional impairment are associated with increased adverse outcomes in various clinical settings. Although combinations of inflammatory or nutrition-related markers have been widely evaluated to demonstrate this relationship, few studies have investigated the associations in surgical populations. In patients anticipating scheduled surgery, the presence of infection, comorbidities, and malnutrition could induce inflammation and deterioration of nutritional status [2124]. Therefore, we hypothesized that preoperative inflammation and nutritional state could predict postoperative outcomes in patients undergoing non-cardiac surgery. In this study, we conducted a comprehensive analysis of the previously reported combinations of inflammatory or nutrition-related markers and demonstrated a significant relationship with mortality after non-cardiac surgery during one-year follow-up.
The predictive performance for one-year mortality shown in the ROC curves was higher for CAR compared with NLR and PLR. CAR is a novel and promising biomarker that is calculated as the ratio of serum CRP and albumin levels. CRP is a major indicator of an acute-phase inflammatory response, and hypoalbuminemia indicates malnutrition as well as the severity of inflammation and disease progression [24,25]. In surgical patients, the pre-existing inflammatory condition could exacerbate malnutrition and markedly augment inflammatory response to surgical injuries [26] that could have directly affected mortality. By combining these two indicators, CAR seems to appropriately reflect both inflammatory and nutritional statuses in the preoperative period. This well explains our result that CAR exhibited higher predictive value compared with other biomarkers based only on inflammatory cell count.
The mGPS uses the same laboratory variables as CAR but stratifies patients into a certain number instead of providing a value as a continuous variable. It is also known as one of the most effective biomarkers for predicting prognosis. Numerous studies simultaneously investigated the prognostic values of mGPS and CAR for cancer patients and showed comparable predictive performances [5,7,27]. According to our analysis, CAR demonstrated a slightly better predictive value for postoperative mortality compared to mGPS. This seems to be owing to the difference in our population that the majority (87%) of patients had mGPS of 0, with only 13% of patients having mGPS values of 1 or 2. This low prevalence of mGPS of 1 and 2 that is associated with poor prognosis could have reduced the discrimination power of mGPS in our cohort. On the other hand, considering that CAR can further classify patients with mGPS of 0 into good and poor prognosis groups, CAR may be a more sensitive marker for predicting postoperative mortality in relatively healthier populations compared to cancer patients. Further research is required for a better understanding of the role of inflammation and nutrition-based markers in relation to mortality after non-cardiac surgery.
The following limitations should be acknowledged when interpreting our results. This is a single-center retrospective study, and residual confounding factors may have affected our results despite proper statistical adjustments. Second, preoperative CRP, albumin, and blood cell counts were selectively obtained. This may have caused a selection bias. Third, the best cut-off values of the markers varied in published reports, potentially weakening the clinical application and generalization of our results. The optional cut-off in non-cardiac surgery has yet to be universally established and must be verified in multicenter and larger cohort studies. Last, our study could not determine whether an improvement in inflammatory and nutritional markers is helpful for postoperative mortality. Future studies are necessary to propose an adequate intervention for patients with high inflammatory and nutritional markers.
Despite these limitations, our study demonstrated associations between preoperative inflammation and nutrition-based markers and postoperative mortality after non-cardiac surgery.
Our study suggests that these indicators could be considered in predicting the long-term prognosis of non-cardiac surgery, and CAR may be the most useful marker. These results may lead to future studies on therapeutic interventions for those with elevated inflammation and nutrition-related biomarkers.
In conclusion, preoperative CAR, NRL, PLR, and mGPS were associated with postoperative mortality after non-cardiac surgery. These inflammation and nutrition-based markers may be helpful in predicting postoperative mortality after non-cardiac surgery. Further extensive studies are warranted to confirm our results.

NOTES

Funding

None.

Conflicts of Interest

No potential conflict of interest relevant to this article was reported.

Data Availability

The datasets generated during and/or analyzed during the current study are available from the corresponding author on reasonable request.

Author Contributions

Ah Ran Oh (Conceptualization; Data curation; Formal analysis; Validation; Writing – original draft)

Jungchan Park (Conceptualization; Formal analysis; Supervision; Writing – original draft; Writing – review & editing)

Jong-Hwan Lee (Supervision; Writing – review & editing)

Kwangmo Yang (Software; Supervision; Validation)

Joonghyun Ahn (Formal analysis)

Seung-Hwa Lee (Supervision; Validation; Writing – review & editing)

Sangmin Maria Lee (Supervision; Writing – review & editing)

Supplementary Materials

Supplementary Table 1.
Baseline characteristics according to estimated threshold of C-reactive protein/albumin ratio > 0.76.
kja-23068-Supplementary-Table-1.pdf
Supplementary Table 2.
Baseline characteristics according to estimated threshold of neutrophil/lymphocyte ratio > 2.78
kja-23068-Supplementary-Table-2.pdf
Supplementary Table 3.
Baseline characteristics according to estimated threshold of platelet/lymphocyte ratio > 11.70
kja-23068-Supplementary-Table-3.pdf
Supplementary Table 4.
Baseline characteristics according to estimated threshold of modified Glasgow prognostic score > 0
kja-23068-Supplementary-Table-4.pdf

Fig. 1.
Receiver-operating curve (ROC) plots for the associations of C-reactive protein-to-albumin ratio (CAR), neutrophil-to-lymphocyte ratio (NLR), platelet-to-lymphocyte ratio (PLR), and modified Glasgow Prognostic Score (mGPS) with one-year mortality and the optimal threshold estimated using Youden’s index with 95% CI. AUC: under the curve.
kja-23068f1.jpg
Fig. 2.
Kaplan-Meier curves for one-year mortality according to (A) C-reactive protein-to-albumin ratio (CAR ) > 0.76, (B) neutrophil-to-lymphocyte ratio (NLR) > 2.78, (C) platelet-to-lymphocyte ratio (PLR), > 11.70, and (D) modified Glasgow Prognostic Score (mGPS) (0/1 or 2). HR: hazard ratio.
kja-23068f2.jpg
Table 1.
Baseline Characteristics according to Mortality during One-year Follow-up
Variable No mortality (n = 97,812) Mortality (n = 4,240) P value
CAR 0.19 (0.08, 0.65) 2.94 (0.51, 12.71) < 0.001
NLR 1.83 (1.34, 2.66) 3.45 (2.07, 6.50) < 0.001
PLR 7.48 (5.71, 10.28) 11.41 (6.97, 19.87) < 0.001
mGPS < 0.001
 0 86676 (88.6) 2064 (48.7)
 1 8482 (8.7) 1053 (24.8)
 2 2654 (2.7) 1123 (26.5)
CRP (mg/L) 0.8 (0.3, 2.8) 10.9 (2.1, 43.6) < 0.001
Albumin (g/dl) 4.4 (4.1, 4.6) 3.8 (3.3, 4.2) < 0.001
Neutrophil (%) 57.9 (50.9, 65.7) 68.8 (58.9, 78.9) < 0.001
Lymphocyte (%) 31.7 (24.6, 38.3) 19.9 (11.9, 28.6) < 0.001
Platelet (cells/µl) 235K (196K, 277K) 227K (159K, 294K) < 0.001
M 48322 (49.4) 2750 (64.9) < 0.001
Age (yr) 55.8 ± 15.3 62.5 ± 13.1 < 0.001
Body mass index (kg/m²) 24.3 ± 3.7 22.6 ± 3.5 < 0.001
ASA physical classification < 0.001
 I 33721 (34.5) 403 (9.5)
 II 55818 (57.1) 2587 (61.0)
 III 7858 (8.0) 997 (23.5)
 IV 398 (0.4) 145 (3.4)
 V 17 (0.0) 108 (2.5)
Habitual risk factor
 Current alcohol 19666 (20.1) 494 (11.7) < 0.001
 Current smoking 8308 (8.5) 281 (6.6) < 0.001
Previous disease
 Hypertension 30837 (31.5) 1465 (34.6) < 0.001
 Diabetes 13959 (14.3) 908 (21.4) < 0.001
 Chronic kidney disease 2569 (2.6) 150 (3.5) < 0.001
 Dialysis 725 (0.7) 64 (1.5) < 0.001
 Stroke 2818 (2.9) 225 (5.3) < 0.001
 Coronary artery disease 2738 (2.8) 152 (3.6) < 0.001
 Heart failure 466 (0.5) 47 (1.1) < 0.001
 Arrhythmia 1936 (2.0) 195 (4.6) < 0.001
 Peripheral artery disease 429 (0.4) 23 (0.5) 0.384
 Aortic disease 506 (0.5) 43 (1.0) < 0.001
 Valvular heart disease 192 (0.2) 11 (0.3) < 0.001
 Chronic obstructive pulmonary disease 2328 (2.4) 191 (4.5) < 0.001
Preoperative blood laboratory tests
 Hemoglobin (g/dl) 13.3 ± 1.8 11.7 ± 1.7 < 0.001
 Creatinine (mg/dl) 1.0 ± 1.0 1.0 ± 0.9 0.080
Operative variables
 General anesthesia 78621 (80.4) 3793 (89.5) < 0.001
 Emergency operation 7421 (7.6) 1100 (25.9) < 0.001
 Operation duration (min) 134.5 ± 100.6 166.7 ± 143.9 < 0.001
 Intraoperative transfusion 4190 (4.3) 740 (17.5) < 0.001
 Intraoperative inotropics infusion 10120 (10.3) 1126 (26.6) < 0.001
Surgical risk
 Mild 28243 (28.9) 651 (15.4) < 0.001
 Intermediate 64402 (65.8) 2892 (68.2) 0.002
 High 5167 (5.3) 697 (16.4) < 0.001
Surgery types
 Neuroendocrine 747 (0.8) 7 (0.2)
 Lung 8187 (8.4) 679 (16.0)
 Head & neck 12514 (12.8) 847 (20.0)
 Breast 1167 (1.2) 12 (0.3)
 Stomach 1336 (1.4) 128 (3.0)
 Hepatobiliary 6662 (6.8) 542 (12.8)
 Colorectal 12442 (12.7) 610 (14.4)
 Urology 12308 (12.6) 351 (8.3)
 Gynecology 7813 (8.0) 80 (1.9)
 Bone, skin, etc. 34636 (35.4) 984 (23.2)

Values are presented as median (Q1, Q3), number (%) or mean ± SD. Surgical risk was stratified according to the 2014 European Society of Cardiology/European Society of Anesthesiology guidelines. CAR: CRP-to-albumin ratio, NLR: neutrophil-to-lymphocyte ratio, PLR: platelet-to-lymphocyte ratio, mGPS: modified Glasgow Prognostic Score, CRP: C-reactive protein, ASA: American Society of Anesthesiologists.

Table 2.
Mortality according to Estimated Threshold of CAR > 0.76, NLR > 2.78, PLR > 11.70, and mGPS > 0
Markers Low group High group Unadjusted analysis IPW analysis
HR (95% CI) P value HR (95% CI) P value
CAR > 0.76 N = 76,732 N = 25,320
 One-year mortality 1275 (1.7) 2965 (11.7) 7.54 (7.06, 8.05) < 0.001 2.38 (2.05, 2.76) < 0.001
 Three-year mortality 3249 (4.2) 4797 (18.9) 4.95 (4.73, 5.17) < 0.001 2.15 (1.97, 2.34) < 0.001
NLR > 2.78 N = 77,129 N = 24,923
 One-year mortality 1665 (2.2) 2575 (10.3) 5.08 (4.77, 5.40) < 0.001 1.81 (1.62, 2.03) < 0.001
 Three-year mortality 3933 (5.1) 4113 (16.3) 3.51 (3.37, 3.68) < 0.001 1.71 (1.60, 1.84) < 0.001
PLR > 11.70 N = 82,228 N = 19,824
 One-year mortality 2168 (2.6) 2072 (10.5) 4.18 (3.94, 4.44) < 0.001 1.86 (1.73, 2.01) < 0.001
 Three-year mortality 4685 (5.7) 3361 (17.0) 3.24 (3.10, 3.39) < 0.001 1.81 (1.72, 1.92) < 0.001
mGPS > 0 N = 88,740 N = 13,312
 One-year mortality 2064 (2.3) 2176 (16.3) 7.79 (7.34, 8.28) < 0.001 2.37 (2.07, 2.72) < 0.001
 Three-year mortality 4824 (5.4) 3222 (24.2) 5.16 (4.94, 5.40) < 0.001 2.11 (1.92, 2.32) < 0.001

Values are presented as number (%). CAR: CRP-to-albumin ratio, NLR: neutrophil-to-lymphocyte ratio, PLR: platelet-to-lymphocyte ratio, mGPS: modified Glasgow Prognostic Score, IPW: inverse probability weighting, HR: hazard ratio.

Table 3.
Subgroup Analysis according to Postoperative Treatment on Association between One-year Mortality and the Estimated Threshold of CAR > 0.76, NLR > 2.78, PLR > 11.70, and mGPS > 0
Markers Low group High group HR (95% CI) P value P value for interaction
CAR > 0.76
 No intensive care treatment 65586 (77.1) 19440 (22.9) 8.44 (7.76, 9.18) < 0.001 < 0.001
 Intensive care treatment 11146 (65.5) 5880 (34.5) 4.81 (4.33, 5.35) < 0.001
 No postoperative transfusion 67070 (77.5) 19478 (22.5) 6.52 (6.02, 7.06) < 0.001 < 0.001
 Postoperative transfusion 9662 (62.3) 5842 (37.7) 7.10 (6.29, 8.00) < 0.001
 No postoperative dialysis 76557 (75.3) 25094 (24.7) 7.56 (7.08, 8.07) < 0.001 0.080
 Postoperative dialysis 175 (43.6) 226 (56.4) 2.95 (1.46, 5.97) 0.003
NLR > 2.78
 No intensive care treatment 65619 (77.2) 19407 (22.8) 5.29 (4.89, 5.72) < 0.001 < 0.001
 Intensive care treatment 11510 (67.6) 5516 (32.4) 3.81 (3.44, 4.21) < 0.001
 No postoperative transfusion 67050 (77.5) 19498 (22.5) 4.65 (4.31, 5.03) < 0.001 < 0.001
 Postoperative transfusion 10079 (65.0) 5425 (35.0) 4.36 (3.92, 4.84) < 0.001
 No postoperative dialysis 77010 (75.8) 24641 (24.2) 5.08 (4.78, 5.41) < 0.001 0.075
 Postoperative dialysis 119 (29.7) 282 (70.3) 1.96 (0.91, 4.22) 0.081
PLR > 11.70
 No intensive care treatment 69372 (81.6) 15654 (18.4) 4.64 (4.30, 5.01) < 0.001 0.542
 Intensive care treatment 12856 (75.5) 4170 (24.5) 3.00 (2.72, 3.31) < 0.001
 No postoperative transfusion 70968 (82.0) 15580 (18.0) 4.26 (3.95, 4.60) < 0.001 < 0.001
 Postoperative transfusion 11260 (72.6) 4244 (27.4) 3.09 (2.08, 3.41) < 0.001
 No postoperative dialysis 81977 (80.6) 19674 (19.4) 4.20 (3.95, 4.46) < 0.001 0.664
 Postoperative dialysis 251 (62.6) 150 (37.4) 1.78 (0.99, 3.21) 0.062
mGPS > 0
 No intensive care treatment 75229 (88.5) 9797 (11.5) 9.02 (8.35, 9.74) < 0.001 < 0.001
 Intensive care treatment 13511 (79.4) 3515 (20.6) 4.59 (4.16, 5.06) < 0.001
 No postoperative transfusion 76918 (88.9) 9630 (11.1) 6.90 (6.39, 7.45) < 0.001 < 0.001
 Postoperative transfusion 11822 (76.3) 3682 (23.7) 6.33 (5.73, 7.01) < 0.001
 No postoperative dialysis 88482 (87.0) 13169 (13.0) 7.82 (7.36, 8.31) < 0.001 0.054
 Postoperative dialysis 258 (64.3) 143 (35.7) 3.23 (1.76, 5.92) 0.002

Values are presented as nunber (%). CAR: CRP-to-albumin ratio, NLR: neutrophil-to-lymphocyte ratio, PLR: platelet-to-lymphocyte ratio, mGPS: modified Glasgow Prognostic Score, HR: hazard ratio.

References

1. Weiser TG, Haynes AB, Molina G, Lipsitz SR, Esquivel MM, Uribe-Leitz T, et al. Size and distribution of the global volume of surgery in 2012. Bull World Health Organ 2016; 94: 201-9F.
crossref pmid pmc
2. Devereaux PJ, Sessler DI. Cardiac complications in patients undergoing major noncardiac surgery. N Engl J Med 2015; 373: 2258-69.
crossref pmid
3. Qu G, Wang D, Xu W, Wu K, Guo W. The systemic inflammation-based prognostic score predicts postoperative complications in patients undergoing pancreaticoduodenectomy. Int J Gen Med 2021; 14: 787-95.
crossref pmid pmc pdf
4. Brattinga B, Rutgers A, De Haan JJ, Absalom AR, van der Wal-Huisman H, de Bock GH, et al. Preoperative inflammatory markers as a predictor of three-year overall survival in older cancer patients undergoing oncologic surgery. Cancers (Basel) 2021; 13: 1824.
crossref pmid pmc
5. Yu X, Wen Y, Lin Y, Zhang X, Chen Y, Wang W, et al. The value of preoperative Glasgow Prognostic Score and the C-Reactive Protein to Albumin Ratio as prognostic factors for long-term survival in pathological T1N0 esophageal squamous cell carcinoma. J Cancer 2018; 9: 807-15.
crossref pmid pmc
6. Matsuo M, Yasumatsu R, Masuda M, Toh S, Wakasaki T, Hashimoto K, et al. Inflammation-based prognostic score as a prognostic biomarker in patients with recurrent and/or metastatic head and neck squamous cell carcinoma treated with nivolumab therapy. In Vivo 2022; 36: 907-17.
crossref pmid pmc
7. Zheng C, Liu S, Feng J, Zhao X. Prognostic value of inflammation biomarkers for survival of patients with neuroblastoma. Cancer Manag Res 2020; 12: 2415-25.
crossref pmid pmc
8. Bora Makal G, Yıldırım O. Are the C-reactive protein/albumin ratio (CAR), neutrophil-to-lymphocyte ratio (NLR), and platelet-to-lymphocyte ratio (NLR) novel inflammatory biomarkers in the early diagnosis of postoperative complications after laparoscopic sleeve gastrectomy? Obes Res Clin Pract 2020; 14: 467-72.
crossref pmid
9. De Magistris L, Paquette B, Orry D, Facy O, Di Giacomo G, Rat P, et al. Preoperative inflammation increases the risk of infection after elective colorectal surgery: results from a prospective cohort. Int J Colorectal Dis 2016; 31: 1611-7.
crossref pmid pmc pdf
10. Sun P, Chen C, Xia Y, Bi X, Liu P, Zhang F, et al. The ratio of C-reactive protein/albumin is a novel inflammatory predictor of overall survival in cisplatin-based treated patients with metastatic nasopharyngeal carcinoma. Dis Markers 2017; 2017: 6570808.
crossref pmid pmc pdf
11. Yang L, Huang Y, Zhou L, Dai Y, Hu G. High pretreatment neutrophil-to-lymphocyte ratio as a predictor of poor survival prognosis in head and neck squamous cell carcinoma: systematic review and meta-analysis. Head Neck 2019; 41: 1525-35.
crossref pmid pmc pdf
12. Takenaka Y, Oya R, Kitamiura T, Ashida N, Shimizu K, Takemura K, et al. Platelet count and platelet-lymphocyte ratio as prognostic markers for head and neck squamous cell carcinoma: meta-analysis. Head Neck 2018; 40: 2714-23.
crossref pmid pdf
13. Dolan RD, McMillan DC. The prevalence of cancer associated systemic inflammation: implications of prognostic studies using the Glasgow Prognostic Score. Crit Rev Oncol Hematol 2020; 150: 102962.
crossref pmid
14. Dinc T, Yildiz BD, Kayilioglu I, Sozen I, Tez M, Coskun F. Prognostic value of preoperative inflammation-based prognostic scores on hospital mortality after gastric cancer surgery. Asian Pac J Cancer Prev 2014; 15: 7909-11.
crossref pmid
15. Mungan İ, Dicle ÇB, Bektaş Ş, Sarı S, Yamanyar S, Çavuş M, et al. Does the preoperative platelet-to-lymphocyte ratio and neutrophil-to-lymphocyte ratio predict morbidity after gastrectomy for gastric cancer? Mil Med Res 2020; 7: 9.
crossref pmid pmc pdf
16. Park JE, Chung KS, Song JH, Kim SY, Kim EY, Jung JY, et al. The C-reactive protein/albumin ratio as a predictor of mortality in critically ill patients. J Clin Med 2018; 7: 333.
crossref pmid pmc
17. Oh TK, Song IA, Lee JH. Clinical usefulness of C-reactive protein to albumin ratio in predicting 30-day mortality in critically ill patients: a retrospective analysis. Sci Rep 2018; 8: 14977.
crossref pmid pmc pdf
18. Leitch EF, Chakrabarti M, Crozier JE, McKee RF, Anderson JH, Horgan PG, et al. Comparison of the prognostic value of selected markers of the systemic inflammatory response in patients with colorectal cancer. Br J Cancer 2007; 97: 1266-70.
crossref pmid pmc pdf
19. Austin PC, Stuart EA. Moving towards best practice when using inverse probability of treatment weighting (IPTW) using the propensity score to estimate causal treatment effects in observational studies. Stat Med 2015; 34: 3661-79.
crossref pmid pmc pdf
20. Latouche A, Porcher R, Chevret S. Sample size formula for proportional hazards modelling of competing risks. Stat Med 2004; 23: 3263-74.
crossref pmid
21. Alizadeh Dehnavi R, de Roos A, Rabelink TJ, van Pelt J, Wensink MJ, et al. Elevated CRP levels are associated with increased carotid atherosclerosis independent of visceral obesity. Atherosclerosis 2008; 200: 417-23.
crossref pmid
22. Martinez BK, White CM. The emerging role of inflammation in cardiovascular disease. Ann Pharmacother 2018; 52: 801-9.
crossref pmid pdf
23. Fedewa MV, Hathaway ED, Ward-Ritacco CL. Effect of exercise training on C reactive protein: a systematic review and meta-analysis of randomised and non-randomised controlled trials. Br J Sports Med 2017; 51: 670-6.
crossref pmid
24. Königsbrügge O, Posch F, Riedl J, Reitter EM, Zielinski C, Pabinger I, et al. Association between decreased serum albumin with risk of venous thromboembolism and mortality in cancer patients. Oncologist 2016; 21: 252-7.
crossref pmid pmc pdf
25. Wang X, Liu S, Zhao X, Fang E, Zhao X. The value of C-reactive protein as an independent prognostic indicator for disease-specific survival in patients with soft tissue sarcoma: a meta-analysis. PLoS One 2019; 14: e0219215.
crossref pmid pmc
26. Dolan RD, Lim J, McSorley ST, Horgan PG, McMillan DC. The role of the systemic inflammatory response in predicting outcomes in patients with operable cancer: systematic review and meta-analysis. Sci Rep 2017; 7: 16717.
crossref pmid pmc pdf
27. Jiang Y, Xu D, Song H, Qiu B, Tian D, Li Z, et al. Inflammation and nutrition-based biomarkers in the prognosis of oesophageal cancer: a systematic review and meta-analysis. BMJ Open 2021; 11: e048324.
crossref pmid pmc


ABOUT
ARTICLE CATEGORY

Browse all articles >

BROWSE ARTICLES
AUTHOR INFORMATION
Editorial Office
101-3503, Lotte Castle President, 109 Mapo-daero, Mapo-gu, Seoul 04146, Korea
Tel: +82-2-792-5128    Fax: +82-2-792-4089    E-mail: journal@anesthesia.or.kr                

Copyright © 2024 by Korean Society of Anesthesiologists.

Developed in M2PI

Close layer
prev next