Comparison of lung aeration loss in open abdominal oncologic surgeries after ventilation with electrical impedance tomography-guided PEEP versus conventional PEEP: a pilot feasibility study
Article information

Abstract
Background
Existing literature lacks high-quality evidence regarding the ideal intraoperative positive end-expiratory pressure (PEEP) to minimize postoperative pulmonary complications (PPCs). We hypothesized that applying individualized PEEP derived from electrical impedance tomography would reduce the severity of postoperative lung aeration loss, deterioration in oxygenation, and PPC incidence.
Methods
A pilot feasibility study was conducted on 36 patients who underwent open abdominal oncologic surgery. The patients were randomized to receive individualized PEEP or conventional PEEP at 4 cmH2O. The primary outcome was the impact of individualized PEEP on changes in the modified lung ultrasound score (MLUS) derived from preoperative and postoperative lung ultrasonography. A higher MLUS indicated greater lung aeration loss. The secondary outcomes were the PaO2/FiO2 ratio and PPC incidence.
Results
A significant increase in the postoperative MLUS (12.0 ± 3.6 vs 7.9 ± 2.1, P < 0.001) and a significant difference between the postoperative and preoperative MLUS values (7.0 ± 3.3 vs 3.0 ± 1.6, P < 0.001) were found in the conventional PEEP group, indicating increased lung aeration loss. In the conventional PEEP group, the intraoperative PaO2/FiO2 ratios were significantly lower, but not the postoperative ratios. The PPC incidence was not significantly different between the groups. Post-hoc analysis showed the increase in lung aeration loss and deterioration of intraoperative oxygenation correlated with the deviation from the individualized PEEP.
Conclusions
Individualized PEEP appears to protect against lung aeration loss and intraoperative oxygenation deterioration. The advantage was greater in patients whose individualized PEEP deviated more from the conventional PEEP.
Introduction
Major surgical procedures are associated with postoperative pulmonary complications (PPCs) [1]. Various strategies have been recommended to reduce PPCs and evidence suggests that intraoperative lung-protective ventilation plays a major role [1,2]. The concept of lung-protective ventilation evolved from acute respiratory distress syndrome (ARDS). Iatrogenic lung injury due to positive pressure ventilation, called ventilator-induced lung injury, occurs due to an interplay of volutrauma, barotrauma, atelectotrauma, biotrauma, and oxytrauma [3]. A ventilatory strategy with low tidal volume (VT), high positive end-expiratory pressure (PEEP), low plateau pressure, and low driving pressure (ΔP) has been found to be beneficial in patients with ARDS [4]. Extrapolating this concept into intraoperative ventilation, researchers are evaluating various lung protective ventilation strategies to reduce the incidence of PPCs [3].
One strategy involves the delivery of high PEEP in the intraoperative setting. However, the evidence for this is mixed, with some studies showing benefits [5,6], and others showing no benefit [7–9]. This might be due to the variable patient profiles, body habitus, body mass index (BMI), lung dimensions, and pleural pressures included in these studies. Thus, the concept of individualized PEEP for intraoperative ventilation has evolved. The methods used to arrive at the ideal PEEP for a patient include best compliance, best oxygenation, esophageal manometry, the pressure–volume curve, stress index, end-expiratory lung volume, computed tomography (CT), lung ultrasonography, and electrical impedance tomography (EIT) [10].
EIT is a bedside, radiation-free, real-time, and noninvasive monitoring modality used to measure regional ventilation. EIT can measure overdistended or collapsed lung fields. During decremental PEEP titration, the appropriate PEEP can be identified based on the balance between overdistended and collapsed areas [11,12]. Studies have shown that EIT can be used to identify the ideal PEEP for each patient [13–15].
Atelectasis following general anesthesia is a major contributing factor to the development of PPCs. Although CT is considered the gold standard for detecting and quantifying atelectasis, it has many disadvantages, such as radiation exposure, the need to shift the patient to the radiology suite, high cost, and limited availability. Recently, lung ultrasonography has been explored as an alternative to CT for identifying lung aeration loss [16]. Lung ultrasonography has been found to correlate with thoracic CT [17,18] and magnetic resonance imaging [19] for identifying lung atelectasis.
We hypothesized that EIT-derived PEEP would reduce the severity of postoperative lung aeration loss. In this pilot feasibility study, we investigated lung aeration loss using lung ultrasonography in patients who underwent open abdominal oncologic surgery after ventilation with conventional or individualized PEEP.
Materials and Methods
Study setting and participants
This prospective, randomized, participant- and outcome-assessor-blinded pilot feasibility study was conducted at the Dr. Bhimrao Ramji Ambedkar Institute Rotary Cancer Hospital, All India Institute of Medical Sciences in New Delhi, India, from August 2019 to September 2021. This study was approved by the Institute Ethics Committee for Postgraduate Research of the All India Institute of Medical Sciences in New Delhi, India (No. IECPG/357/5/2019) and was registered at https://ctri.nic.in/ (No. CTRI/2019/07/020351; principal investigator: Karthik AR, date of registration: July 24, 2019) prior to patient enrolment. Written informed consent was obtained from all participants before enrolment in the study. Patients aged 18–65 years with American Society of Anesthesiologists (ASA) physical statuses of I, II, or III who underwent elective open abdominal oncologic surgery and provided consent were included in the study. Patients who met the following criteria were excluded from the study: (1) BMI < 18.5 kg/m2 or > 35 kg/m2; (2) moderate to severe pulmonary function test abnormalities (i.e., less than 80% predicted forced vital capacity [FVC] or forced expiratory volume in the first second [FEV1] or FEV1/FVC); (3) serum albumin levels < 3.0 g/dl; (4) presence of a pacemaker; (5) undergoing surgery involving an incision not extending above the level of the umbilicus; and (6) undergoing surgery lasting < 2 h in duration. All the procedures were performed in accordance with the Declaration of Helsinki, 2013. This manuscript adheres to the Consolidated Standards of Reporting Trials (CONSORT) format.
Study protocol
A total of 40 patients were enrolled in the study. The patients were eventually randomized to receive either EIT-derived PEEP (EIT PEEP group) or conventional PEEP (PEEP 4 group) ventilation at a 1:1 ratio. Computer-generated block randomization was performed using block sizes of 2, 4, and 6. Patients who satisfied the inclusion criteria and provided consent were enrolled in the study the day before the procedure. The patients and outcome assessors were blinded to group allocation. Allotment concealment was achieved using sequentially numbered opaque sealed envelopes.
After enrolment in the study, an arterial blood gas (ABG) analysis was performed with the patients on room air the evening before surgery on a GEM Premier 3000 machine (Instrumentation Laboratory). On the day of surgery, patients were attached to the following standard monitors in the operating room: electrocardiography, pulse oximetry, and noninvasive blood pressure.
A baseline chest ultrasonography was performed using an Edge II ultrasound machine (FUJIFILM Sonosite) with a low-frequency (5–2 MHz) convex probe. The long axis of the probe was placed perpendicular to the long axis of the intercostal space. Ultrasonography was performed in 12 areas, divided by the anterior and posterior axillary lines into anterior, lateral, and posterior zones. The anterior and lateral zones were further divided into superior and inferior areas at the line across the nipples, and the posterior zone was divided below the level of the scapula into medial and lateral areas, to a total of 12 areas, six on each side (Supplementary Figs. 1–3). Given that ultrasonography of the scapula cannot be used to study the lungs, this area was omitted. Short video clips from each area were taken and labelled with the participant number and recorded in the ultrasound machine.
After securing the intravenous lines, patients underwent epidural catheter placement, unless contraindicated, at a vertebral level appropriate for the surgery. An EIT belt was placed along the fourth or fifth intercostal space and EIT monitoring (PulmoVista® 500, Dräger Medical) was initiated (Supplementary Figs. 4–7). A Primus® (Dräger Medical) anesthesia workstation was used to administer the general anesthesia. After pre-oxygenation with 100% oxygen for 5 min, general anesthesia induction and endotracheal intubation were performed with intravenous fentanyl 2 µg/kg, propofol 2.5 mg/kg, and rocuronium 1 mg/kg. Mechanical ventilation was initiated in volume-controlled ventilation (VCV) mode with a VT of 6 ml/kg of predicted body weight (PBW), PEEP of 4 cmH2O, inspiratory pause of 30%, and FiO2 of 50% with an appropriate respiratory rate (RR) to maintain end-tidal carbon dioxide (ETCO2) at 35–45 mmHg. The PBW was calculated using the following formulae: [20] PBW (kg) for males = 50 + 0.91 (height [cm] – 152.4); PBW (kg) for females = 45.5 + 0.91 (height [cm] – 152.4).
An arterial line was placed in one of the radial arteries, and invasive blood pressure monitoring was initiated. ETCO2 and anesthesia gas were monitored using a side-stream monitor. Central venous access was obtained as required. Anesthesia was maintained using an oxygen-air mixture, sevoflurane, and intermittent rocuronium boluses. Analgesia was maintained via the epidural route along with intermittent intravenous fentanyl boluses.
Lung recruitment was performed in a graded fashion in pressure-controlled ventilation mode with a Pinsp of 25 cmH2O, PEEP of 10 cmH2O for 45 s; Pinsp of 30 cmH2O, PEEP of 15 cmH2O for 45 s; and Pinsp of 35 cmH2O, PEEP of 20 cmH2O for 45 s. The I:E ratio was set at 1:1, and the RR was set at 10/min during recruitment. After recruitment, the ventilation mode was changed to VCV mode with a VT of 6 ml/kg of PBW, I:E ratio of 1:2, inspiratory pause of 30%, and PEEP of 20 cmH2O with an appropriate RR to maintain ETCO2 at 35–45 mmHg. Decremental PEEP titration was performed in VCV mode by decreasing the PEEP in increments of 2 cmH2O every 45 s up to zero PEEP. The PEEP trial analysis was performed using an EIT monitor.
The EIT monitor was used to measure the compliance loss at various levels of PEEP and plotted on two lines, one each for compliance loss at high and low PEEP. The compliance loss at the high and low PEEP lines measured compliance loss due to alveolar hyperdistension and collapse, respectively. The point at which both lines intersected was considered the point of compromise between alveolar hyperdistension and collapse. The nearest PEEP value above this point was considered the individual’s ideal PEEP (Fig. 1 and Supplementary Fig. 8).

PEEP titration analysis in the EIT monitor. The white and orange lines in the lower portion of the image denote the compliance loss at low and high PEEP levels, respectively. The values on the lines denote the percentage compliance loss. Timepoints A–J denote each step in the PEEP titration, with A at a PEEP of 20 cmH2O and J at a PEEP of 2 cmH2O. The lines intersect between points G and H, with G at a PEEP of 8 cmH2O and H at a PEEP of 6 cmH2O. The greater PEEP value of 8 cmH2O is taken as the EIT-derived PEEP for this patient. PEEP: positive end expiratory pressure, EIT: electrical impedance tomography, C loss HP: compliance loss towards higher PEEP levels, C loss LP: compliance loss towards lower PEEP levels.
The patients were randomized to the EIT PEEP or PEEP 4 group. After randomization, the patients underwent a second recruitment maneuver, similar to the first. After the second recruitment, ventilation was changed to the VCV mode with PEEP set to the EIT PEEP value or to 4 cmH2O according to the randomized group. The rest of the surgery proceeded using the new PEEP value in VCV mode with other ventilatory parameters as before.
If the target ETCO2 was not achieved with a maximum RR of 20/min, the VT was increased to a maximum of 8 ml/kg PBW. Fluid management, blood products, and anesthetic regimens were administered at the discretion of the attending anesthesiologist. If hypotension (defined as a decrease in mean arterial pressure > 20% of the baseline) occurred at any point, it was managed with vasopressors, the choice of which was at the discretion of the attending anesthesiologist. Extubation was performed in pressure support ventilation mode with the allocated PEEP. One hour after extubation, a similar chest ultrasonography was performed and short video clips were labelled and saved. The video clips contained only the patient sequence number; no information about the randomization group or the patient’s identity was included.
ABGs were obtained at various time points (Supplementary Fig. 9). Analgesia was titrated to a Numeric Rating Scale score for pain of 3/10. The patients were followed up for up to three postoperative days for the development of PPCs, if any.
Data collection
The following data were collected: (1) modified lung ultrasound score (MLUS), (2) PaO2/FiO2 ratio, (3) hemodynamic variables (pulse rate and blood pressure), and (4) PPCs. The pre- and post-operative ultrasound video clips for all patients were recorded by the same anesthesiologist, with more than three years of experience in lung ultrasonography. The video clips were analyzed by two pulmonologists, each with more than five years of experience in lung ultrasonography. An MLUS, as described by Monastesse et al. [16], was generated. The MLUS was chosen over the original lung ultrasound score as the former was found to be more sensitive [16]. Each of the 12 areas of the lung was assigned a score between 0 and 3 as follows: (a) up to 2 B lines: score 0, (b) more than 3 B lines or small subpleural consolidations separated by a normal pleural line: score 1, (c) multiple coalescent B lines or multiple small subpleural consolidations separated by a thickened or irregular pleural line: score 2, and (d) lung consolidation or small subpleural consolidation >1 × 2 cm in diameter: score 3. A total score ranging from 0 to 36 was calculated by adding the individual scores for each of the 12 areas (with a higher score indicating greater lung aeration loss). The two pulmonologists were informed of the scoring system before the analysis was conducted. Representative lung ultrasound images are shown in Supplementary Figs. 10 and 11. The pulmonologists were blinded to the randomization groups as the video clips did not contain any identifying information. The PPCs studied were respiratory infection, respiratory failure, pleural effusion, atelectasis, pneumothorax, bronchospasm, and aspiration pneumonitis, as described previously by Canet et al. [21]. The primary outcome was the impact of individualized PEEP on the change in the MLUS between the pre- and post-operative lung ultrasound. The secondary outcomes were the PaO2/FiO2 ratio and PPC incidence. Fig. 2 presents a procedural flow diagram of the study.
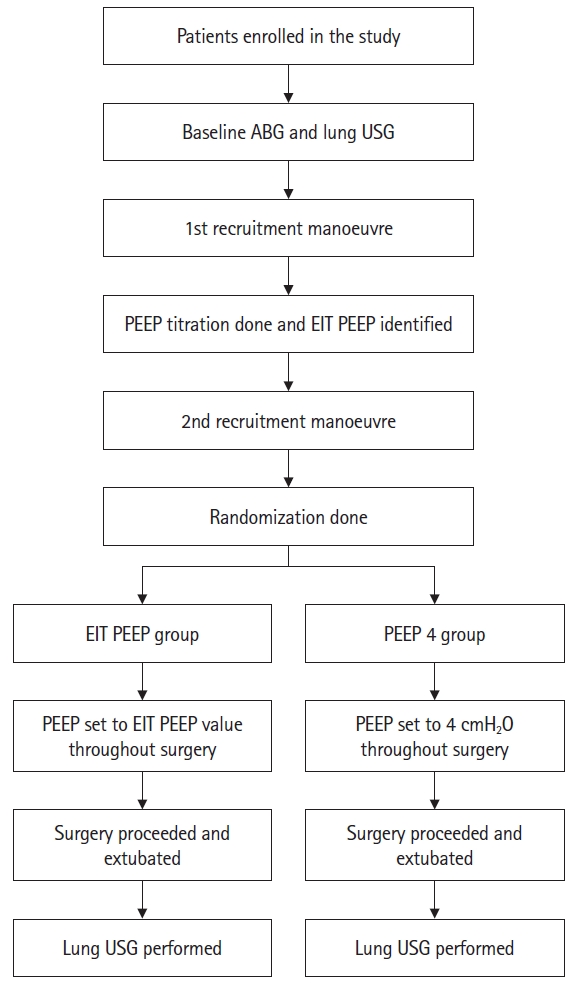
Procedural flow diagram of the study. ABG: arterial blood gas analysis, USG: ultrasonography, PEEP: positive end expiratory pressure, EIT: electrical impedance tomography.
Statistical analysis
Given the nature of this study as a pilot, we postulated that a mean 2-point difference in the MLUS calculated at each time point with a standard deviation of 2 would be observed. Assuming a power of 80%, a level of significance (two-tailed) of 5%, and an incomplete dataset of 15% of the patients, we estimated that 20 patients would need to be enrolled in each group. The data was analyzed using STATA® software version 14.0 (StataCorp.). Categorical variables are presented as numbers and percentages (%), and continuous variables are presented as the mean ± standard deviation (SD). The normality of the data was tested using the Shapiro-Wilk test. The duration of surgery was not normally distributed. The unpaired Student’s t-test was applied for normally distributed data, and the Mann-Whitney U test was applied if normality was not assumed for between-group comparisons. Qualitative variables were compared using the χ2 test or Fisher’s exact test. The Spearman’s rank correlation test was used to observe the correlation between quantitative variables, as appropriate. Interobserver reliability in lung ultrasound scores were assessed using the intraclass correlation coefficient (ICC) and Cronbach’s α. Differences were considered statistically significant at P < 0.05.
Results
Forty patients were randomized into two groups, the EIT PEEP group and the PEEP 4 group (20 patients per group). One patient in the EIT PEEP group was extubated on the first postoperative day because of intraoperative hemodynamic instability. One patient with stomach carcinoma in the PEEP 4 group underwent a thoracotomy and one-lung ventilation during the intraoperative period. Another patient in the PEEP 4 group was extubated on the third postoperative day because of severe hemodynamic instability and postoperative hepatic and renal dysfunction. A third patient in the PEEP 4 group was reintubated in the immediate postoperative period because of hypoventilation and sedation. All four of these patients were excluded from the final analysis. Thus, data from a total of 19 patients in the EIT PEEP group and 17 patients in the PEEP 4 group were analyzed. The CONSORT flow diagram of the study is shown in Fig. 3.
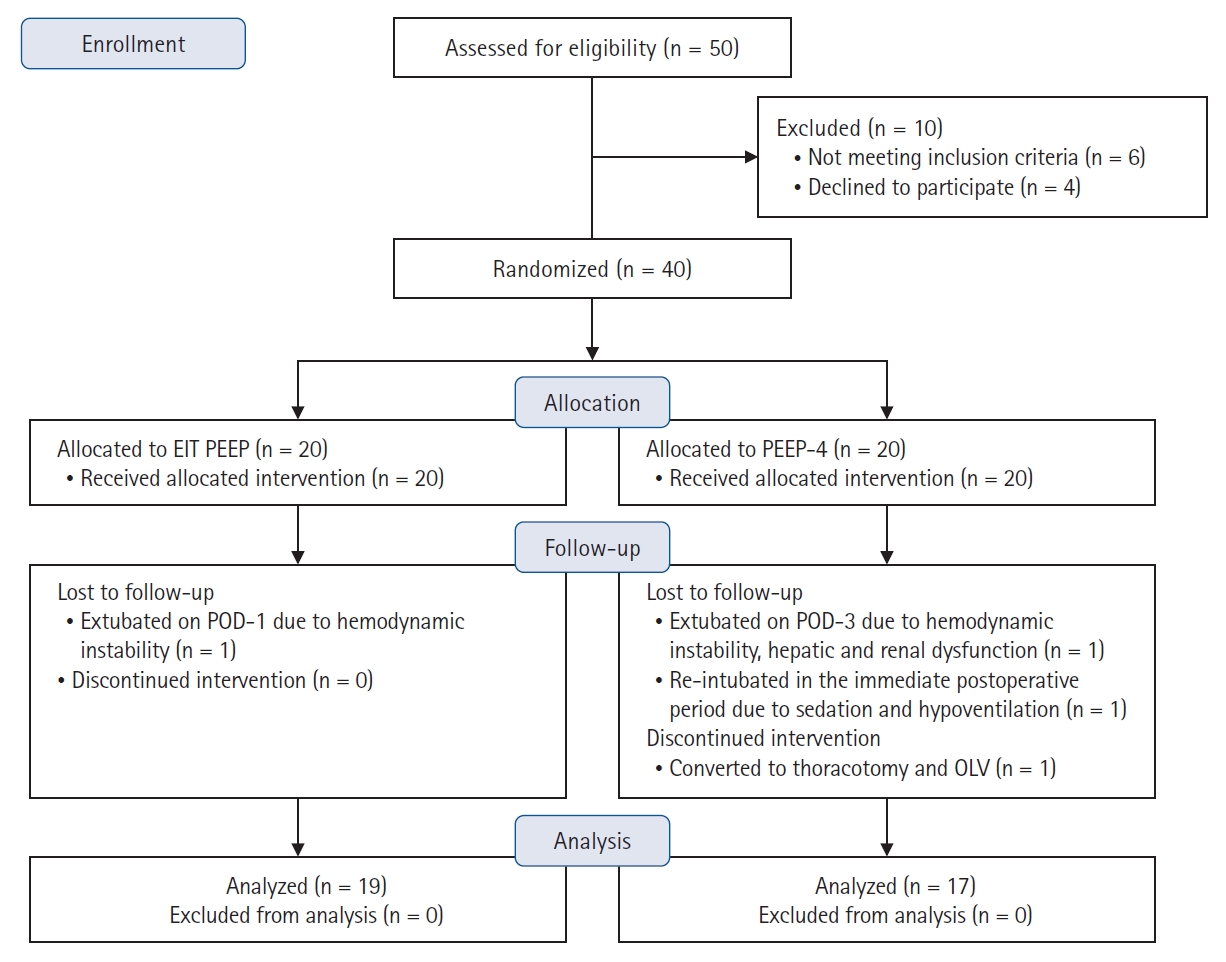
Consolidated Standards of Reporting Trials (CONSORT) flow diagram. EIT: electrical impedance tomography, PEEP: positive end expiratory pressure, POD: postoperative day, OLV: one lung ventilation.
The baseline patient characteristics were comparable between the two groups (Table 1). Some correlations between the BMI and EIT-derived PEEP values were found in all 36 patients in both groups (r = 0.567, P < 0.001) (Supplementary Fig. 12). The EIT-derived PEEP of all 36 patients ranged from 4 to 14 cmH2O (mean ± SD: 8.4 ± 2.8 cmH2O). Perioperative patient parameters were comparable between the two groups (Supplementary Table 1). For the duration of surgery, two outliers were noted in the PEEP 4 group.

Baseline Patient Characteristics
Fig. 4 shows the MLUS values for the two groups. The baseline preoperative MLUS values were comparable between the two groups (5.0 ± 3.8 vs 4.8 ± 1.7, P = 0.823); however, the postoperative MLUS was significantly higher in the PEEP 4 group (denoting a higher degree of lung aeration loss) than in the EIT PEEP group (12.0 ± 3.6 vs 7.9 ± 2.1, P < 0.001). Similarly, the difference between the post- and preoperative MLUS values was significantly higher in the PEEP 4 group than in the EIT PEEP group (7.0 ± 3.3 vs 3.0 ± 1.6, P < 0.001).
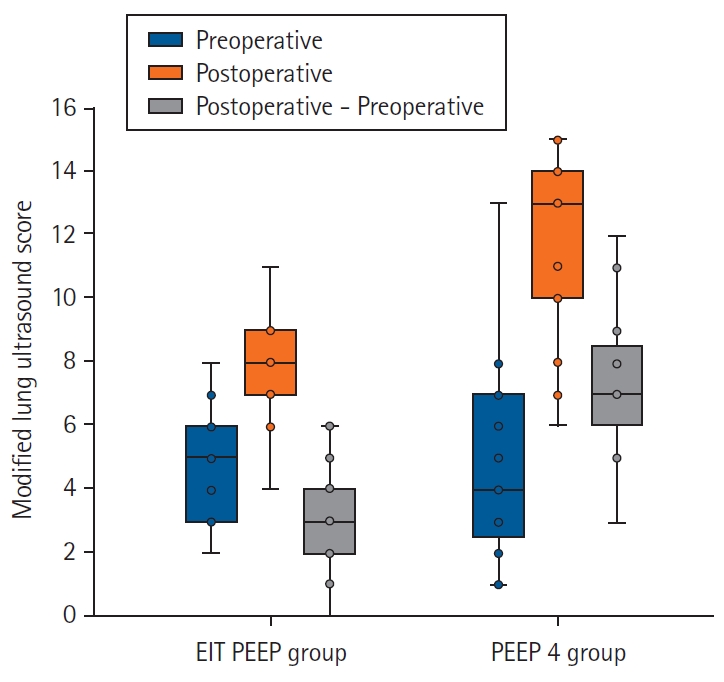
Box and whisker plot of modified lung ultrasound scores for each group. EIT: electrical impedance tomography, PEEP: positive end expiratory pressure.
The ABG parameters are presented in Supplementary Table 2. The PaCO2, pH, HCO3- and lactate levels were comparable between the two groups at all time points. PaO2/FiO2 ratios were comparable between the two groups at baseline and after the second recruitment. However, the PaO2/FiO2 ratio was significantly lower in the PEEP 4 group than in the EIT PEEP group at one hour after randomization and before extubation. In addition, the PaO2/FiO2 ratio at one hour after extubation and one day after extubation were lower in the PEEP 4 group than in the EIT PEEP group, though this difference was not statistically significant.
The interobserver reliability of the lung ultrasound scores between the two observers is presented in Supplementary Table 3. For the individual video clips, the ICC between the two observers ranged from 0.722 to 0.989 (P < 0.001). The ICC between the two observers for the total pre- and post-operative MLUS values were 0.987 and 0.988, respectively (P < 0.001), denoting good reliability between the observers.
A post-hoc analysis was performed to study the correlation between the delta PEEP (ΔPEEP) and various parameters (Table 2). The ΔPEEP was calculated as the difference between the EIT-derived PEEP and the set PEEP for all 36 patients. This analysis was possible because data was collected on the EIT PEEP in all patients.
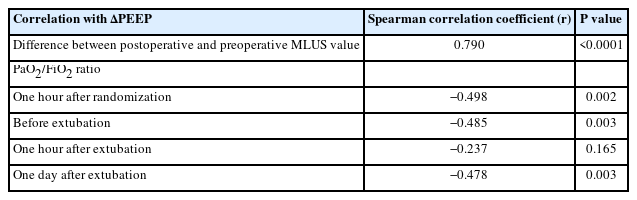
Correlation between the ΔPEEP and Various Parameters
ΔPEEP = EIT-derived PEEP – set PEEP
Since all patients in the EIT PEEP group had their intraoperative PEEP set to the EIT-derived PEEP value, their ΔPEEP was zero. Three patients in the PEEP 4 group had an EIT-derived PEEP of 4 cmH2O; thus, their ΔPEEP was also zero. The remaining 14 patients in the PEEP 4 group had a ΔPEEP ranging from 2 to 10 cmH2O (Supplementary Table 4).
A strong positive correlation was found between the ΔPEEP and the difference between the postoperative and preoperative MLUS values. The negative correlation between the ΔPEEP and the PaO2/FiO2 ratios at one hour after randomization, before extubation, and 24 h after extubation was significant. However, the negative correlation between the ΔPEEP and PaO2/FiO2 ratio at one hour after extubation was not significant.
The PPCs are presented in Supplementary Table 5. The incidence of PPCs was not significantly different between the groups. Neither of the outliers for the duration of surgery in the PEEP 4 group had PPCs. Hence, these outliers should not have influenced the results.
Discussion
High-quality evidence regarding the ideal intraoperative setting for PEEP to minimize PPCs or improve clinical outcomes is not available in the existing literature. Most studies have recommended avoiding zero PEEP and high VT during the intraoperative period. However, the exact value of PEEP for improving postoperative outcomes remains unclear. Given the growing evidence that a single PEEP value may not be ideal for all patients, or even for the same patient at various time points, the concept of individualized PEEP has been evaluated. However, the optimal method for identifying these PEEP values remains unclear. We chose EIT monitoring because preliminary evidence has suggested that EIT-guided PEEP titration might be superior to the most commonly used conventional best compliance method [13]. However, various PEEP titration methods are available for EIT monitoring, such as using the point of balance between lung collapse and hyperdistension or using the regional ventilation delay index. As no current literature has confirmed the superiority of either method, we chose the former.
The methods used to evaluate the effectiveness of intraoperative ventilation strategies need to be simple, accurate, reproducible, and available at the point of care. EIT and lung ultrasonography are radiation-free point-of-care modalities. However, their utility in the exploration of ideal intraoperative PEEP needs to be evaluated. We chose the following subset of surgeries in which PPCs are expected: open abdominal surgeries with the patient in various positions, with an incision extending above the umbilicus and lasting more than two hours. Because our institute is an oncology hospital, all recruited patients underwent oncologic surgeries.
Baseline demographic parameters, preoperative MLUS values, perioperative fluid balance measures, vasopressor requirements, duration of surgery, posture during surgery, and anesthetic techniques were similar between the groups. The requirement for vasopressors was higher in both groups after the first recruitment, likely because this was performed immediately after induction, an observation consistent with that of Pereira et al. [14]. Slightly more number of patients in the EIT PEEP group required vasopressors than in the PEEP 4 group, although this difference was not statistically significant.
Because ultrasonography is an operator-dependent modality, we evaluated the interobserver reliability between the two independent observers in scoring the lung ultrasound video clips. Interobserver reliability and repeatability were good for both the preoperative and postoperative MLUS values. The immediate postoperative MLUS values were significantly higher in the PEEP 4 group than in the EIT group (P < 0.001). The change in the MLUS was also significantly higher in the PEEP 4 group (P < 0.001), indicating greater lung aeration loss in the PEEP 4 group than in the EIT PEEP group. Thus, the primary outcome supported our hypothesis.
The PaO2/FiO2 ratios at baseline and after the second recruitment were similar between the two groups. This indicates that the lung condition was similar in both groups before randomization. The PaO2/FiO2 ratio at one hour after randomization was significantly lower in the PEEP 4 group than that in the EIT group (P = 0.049). The PaO2/FiO2 ratio immediately before extubation was significantly lower in the PEEP 4 group (P = 0.025), suggesting a deterioration in oxygenation at a lower PEEP. However, oxygenation was similar in both groups one hour and one day after extubation. This indicates that the advantage gained through individualized PEEP did not extend into the postoperative period. This is consistent with the observations presented by Nestler et al. [22] and Généreux et al. [23] and suggests that the lung aeration advantage in the EIT PEEP group was lost during the postoperative period. Thus, measures to keep the alveoli recruited during the postoperative period may be necessary to sustain improvements in oxygenation.
The PPC-related secondary outcomes did not support our hypothesis. Although the incidence of PPCs was higher in the PEEP 4 group, the difference was not statistically significant.
The EIT-derived PEEP of all 36 patients ranged from 4 to 14 cmH2O. This correlated reasonably well with the BMI of the patients, such that patients with a higher BMI demonstrated a higher ideal PEEP. This is consistent with the findings of Pereira et al. [14]. As we had determined the ideal PEEP values for the patients in both groups, we were able to evaluate whether lung aeration loss was greater with increased deviation from the ideal PEEP value. To examine this correlation, we performed a post-hoc analysis. We defined the deviation from the ideal PEEP as the ΔPEEP. As expected, the ΔPEEP value correlated well with the change in the MLUS. In other words, the more the set PEEP value deviated from the ideal PEEP value, the greater the lung aeration loss. This correlation was also reflected in a decrease in arterial oxygenation: the greater the deviation from the ideal PEEP, the greater the decrease in oxygenation intraoperatively. However, this correlation disappeared in the immediate postoperative period. A moderate correlation was found between the ΔPEEP and the decrease in oxygenation one day after extubation. We could not find any previous study that evaluated the correlation between the deviation from the ideal PEEP and various respiratory parameters.
Our study has certain limitations. First, it was performed as a pilot study to determine feasibility and offer information to refine the methodology for a larger study. Thus, it was conducted on a small sample size at a single center and was not adequately powered to study the outcomes. Additionally, this study was conducted only on patients undergoing oncologic surgery. Thus, the applicability of these results to the general population may not be valid. Second, the EIT belt was attached along the fourth or fifth intercostal space, and information gathered by the EIT monitor was consistent with the region of the lungs only at that level. Lung regions above or below this level may have a different balance of collapse and hyperdistension; thus, a global picture may not be possible. Third, the study population had low ASA physical status scores. The hemodynamic implications of PEEP titration and maintenance of EIT-derived PEEP throughout surgery have not been studied in more unstable patients. CT of the thorax is considered the gold standard for quantifying lung atelectasis. However, given the risk of radiation exposure and the need to shift the immediate postoperative patient to the CT suite, we chose to perform lung ultrasonography. Preliminary literature suggests that lung ultrasonography correlates well with other modalities for identifying lung aeration loss. Because ultrasonography is also known for its operator dependency, we established the interobserver reliability of the MLUS before using it for outcome measurements. However, adequately powered studies with larger sample sizes are required to validate the score and establish the inter- and intra-observer reliabilities of the MLUS.
In conclusion, patients ventilated with EIT-derived PEEP experienced less lung aeration loss than those ventilated with conventional PEEP. Intraoperative oxygenation was better in the EIT PEEP group than in the conventional PEEP group. However, sustained oxygenation was lost in the postoperative period after the removal of the EIT PEEP. No significant difference was found in the incidence of PPCs between the groups. Additionally, significant correlations were found between deviation from the ideal PEEP and lung aeration loss and deterioration in intraoperative oxygenation. This suggests that the more a patient’s ideal PEEP deviates from the conventional PEEP, the more benefits are expected from an individualized PEEP titration protocol. Further adequately powered studies are required to validate our results. We intend to perform a definitive randomized controlled trial with a larger sample size and methodological improvements based on the results of this study.
Acknowledgements
The authors would like to thank Dr. Maroof Ahmad Khan and Dr. Rajeev Kumar Malhotra for their support in the statistical analysis.
Notes
Funding
None.
Conflicts of Interest
No potential conflict of interest relevant to this article was reported.
Data Availability
All data generated or analyzed during this study are included in this published article [and its supplementary information files].
Author Contributions
A. R. Karthik (Conceptualization; Data curation; Formal analysis; Investigation; Methodology; Visualization; Writing – original draft; Writing – review & editing)
Nishkarsh Gupta (Data curation; Methodology; Writing – review & editing)
Rakesh Garg (Data curation; Methodology; Supervision; Writing – review & editing)
Sachidanand Jee Bharati (Data curation; Methodology; Writing – review & editing)
M. D. Ray (Data curation; Methodology; Resources; Writing – review & editing)
Vijay Hadda (Conceptualization; Formal analysis; Investigation; Writing – review & editing)
Sourabh Pahuja (Data curation; Formal analysis; Writing – review & editing)
Seema Mishra (Conceptualization; Data curation; Supervision; Writing – review & editing)
Sushma Bhatnagar (Data curation; Project administration; Resources; Supervision; Writing – review & editing)
Vinod Kumar (Conceptualization; Data curation; Supervision; Writing – review & editing)
Supplementary Materials
Ultrasound areas in the anterior chest wall.
Ultrasound areas in the lateral chest wall.
Ultrasound areas in the posterior chest wall.
Electrical Impedance Tomography (EIT) monitor.
EIT belt attached around the chest – anterior view.
EIT belt attached around the chest – lateral view.
Screenshot of EIT monitoring screen.
PEEP titration analysis of a patient in EIT monitor.
Timepoints of arterial blood gas measurement.
Snapshot from an ultrasound clip showing a normal pleural line.
Snapshot from an ultrasound clip showing a thickened and irregular pleural line along with a small subpleural consolidation.
Scatter plot of BMI and EIT derived PEEP.
Perioperative patient parameters.
Arterial blood gas parameters.
Inter-observer reliability of modified lung ultrasound score.
EIT derived PEEP and ∆PEEP of the participants.
Incidence of postoperative pulmonary complications.