


Introduction
Selecting an appropriate size and depth of the endotracheal tube (ETT) is essential to minimize intubation-related complications in pediatric patients. An improper ETT size may require reintubation, increasing the risk of airway injury and prolonged apnea [1–3]. Moreover, inaccurate estimation of tube depth can cause bronchial intubation that can result in pneumothorax or atelectasis. By contrast, shallow insertion of an ETT can lead to an unsecured airway or inadequate ventilation [4].
Several methods have been proposed to select the optimal ETT size. Among those, Cole’s age-based formula is typically used in clinical practice to estimate the internal diameter (ID) of uncuffed ETTs [5]. Other age-based formulae, such as those proposed by Khine et al. [6] and Duracher et al. [7], have been suggested for cuffed ETTs. The age-based formulae have also been used to estimate the optimal depth of ETT insertion [8]. However, several inaccuracies have been reported in these age-based formulae [9–11]. These inaccuracies might be because of the nonlinearity of tracheal growth with age. Another possible reason is inter-individual discrepancies in ETT size among individuals of the same age [12–14].
Machine learning algorithms handling complex nonlinear relationships have shown excellent performance in various medical fields [15]. However, few studies have integrated machine learning models to suggest the optimal ETT size and depth for pediatric patients [16]. Zhou et al. [16] implemented machine learning techniques with image-based features such as tracheal diameter at the C6, C7, and T2 levels or the distance from C6 to the tracheal carina. However, their model requires manual measurements by clinicians using X-ray images that are not usually available for pediatric surgical patients. By contrast, basic demographic data, such as age, sex, weight, and height, can be easily acquired from the most recent electronic health record system.
In this study, we aimed to develop and validate an explainable machine learning model to predict the optimal ETT size and depth for pediatric patients using only demographic data. Our hypothesis was that the machine learning model would outperform traditional age-based formulae in predicting the optimal ETT size and depth. A favorable model developed through this approach may be beneficial in routine anesthesia practice.
Materials and Methods
The Institutional Review Board of Seoul National University Hospital (Approval number: 2304-012-1418) approved this study and waived the requirement for informed consent owing to the retrospective nature of the study design. We followed the recommendations of the ‘Strengthening the Reporting of Observational Studies in Epidemiology’ guidelines [17].
Study population
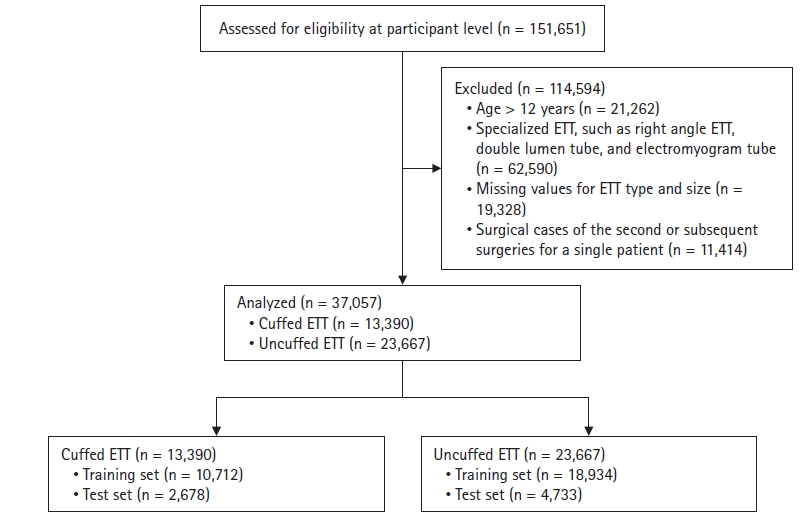
Data were collected from 151,651 pediatric surgical patients who underwent general anesthesia with endotracheal intubation at Seoul National University Hospital from October 2004 to November 2022. Cases with the following characteristics were excluded: (1) age > 12 years; (2) specialized ETT type, such as right angle endotracheal, double lumen, and electromyogram tubes; (3) missing values for ETT type and size in the anesthesia note; and (4) surgical cases of second or subsequent surgeries for a single patient.
Data collection
Nursing and anesthesia notes were extracted from the hospital’s clinical data warehouse. The most recent values of sex, height, and weight before surgery were extracted from the nursing notes. The ETTs utilized throughout the study period were ShileyTM Oral/Nasal Endotracheal Tube Cuffless Murphy Eye (Medtronic, Ireland) or ShileyTM Hi-Lo Oral/Nasal Tracheal Tube (Medtronic, Ireland). The type, size (ID), and fixed depth (distance from tip to lip corner) of the ETT were identified from the anesthesia notes.
A routine practice during the study at our hospital was selecting the ETT size based on Cole’s formula, as decided by the attending anesthetists. If ventilation was inadequate owing to a leak, the patient was reintubated with a larger ETT. By contrast, if the tube size was large and did not advance within the trachea, a smaller size was retried. The optimal tube depth was determined by auscultation. After tracheal intubation, the ETT was introduced until the right upper lobe breath sounds disappeared. Subsequently, the tube was withdrawn until the upper lobe breath sounds reappeared. An additional length (1–2 cm) was retracted to prevent bronchial intubation by position change. Once fixed, the presence of breath sounds from both lung fields was reconfirmed, and the depth marker at the lip corner was recorded in the anesthesia note. The ID and depth of the ETT were recorded as 0.5 mm and 0.5 cm, respectively.
Model development
We developed regression models using gradient boosted regression tree (GBRT) and linear regression (LR) to predict the size and depth of the ETT separately. Due to the distinct rationale behind tube selection, we trained separate models to predict the size and depth of uncuffed and cuffed ETTs. Statistical outliers (± 2SD [standard deviation]) for height, weight, tube size, and depth within one-year intervals were considered as missing values. We performed multiple imputations to substitute the missing height and weight values.
The most recent 20% of the data was designated as the test dataset. The remaining data were assigned as the training dataset, separately for uncuffed and cuffed ETT types, to train the models. The test dataset was used to evaluate and compare the performances with that of the traditional formulae. Subsequently, we used the BorutaSHAP method to select the necessary input variables from demographic data (age, sex, height, and weight) in the GBRT model. This method combines the Boruta feature selection algorithm with the Shapley value calculations [18]. After selecting the most relevant variables, they were incorporated into the final input of the machine learning models to predict the ID and fixed depth of the ETT. The hyperparameters for the GBRT model were determined using ten-fold cross-validation, and a grid search was performed for each combination of the hyperparameters. Supplementary Table 1 lists the hyperparameter combinations.
Outcome variables
The ETT size predicted by the models was rounded to the nearest 0.5 mm. The primary outcome for the size model was the macro-averaged F1 score that comprehensively evaluates the model’s performance across all classes by calculating the unweighted mean value of the F1 score for each class. Additionally, we computed the accuracy of predicting the exact size and the size within 0.5 mm of the tube, given that clinicians typically prepare three sizes of ETTs in case of failure.
To compare the performance of our model in predicting the size of an ETT, we selected Cole’s formula [5] for an uncuffed ETT (ID [mm] = age in years / 4 + 4.0) and Duracher’s formula [7] for a cuffed ETT (ID [mm] = age in years / 4 + 3.5) as traditional age-based formulae. For below one year of age, an ID of 3.5 mm was used, and for between one and two years of age, 4.0 mm was used for the uncuffed ETT, as Cole’s formula applies over the age of two. A size smaller by one was used for cuffed ETTs for ages less than two years. The Penlington’s formula (ID [mm] = age in years / 4 + 4.5) was also used to estimate the uncuffed ETT size [19].
The primary outcome of the depth model was measured in terms of the mean absolute error (MAE). Additionally, root mean squared error (RMSE) and R-squared were calculated to evaluate the performance of the depth model. To calculate the depth of the ETT, we selected traditional age-based formulae based on the Pediatric Advanced Life Support (PALS) guidelines (recommended depth of insertion [cm] = age in years / 2 + 12) [8]. We compared the performance of the GBRT models with that of traditional age-based formulae and LR models.
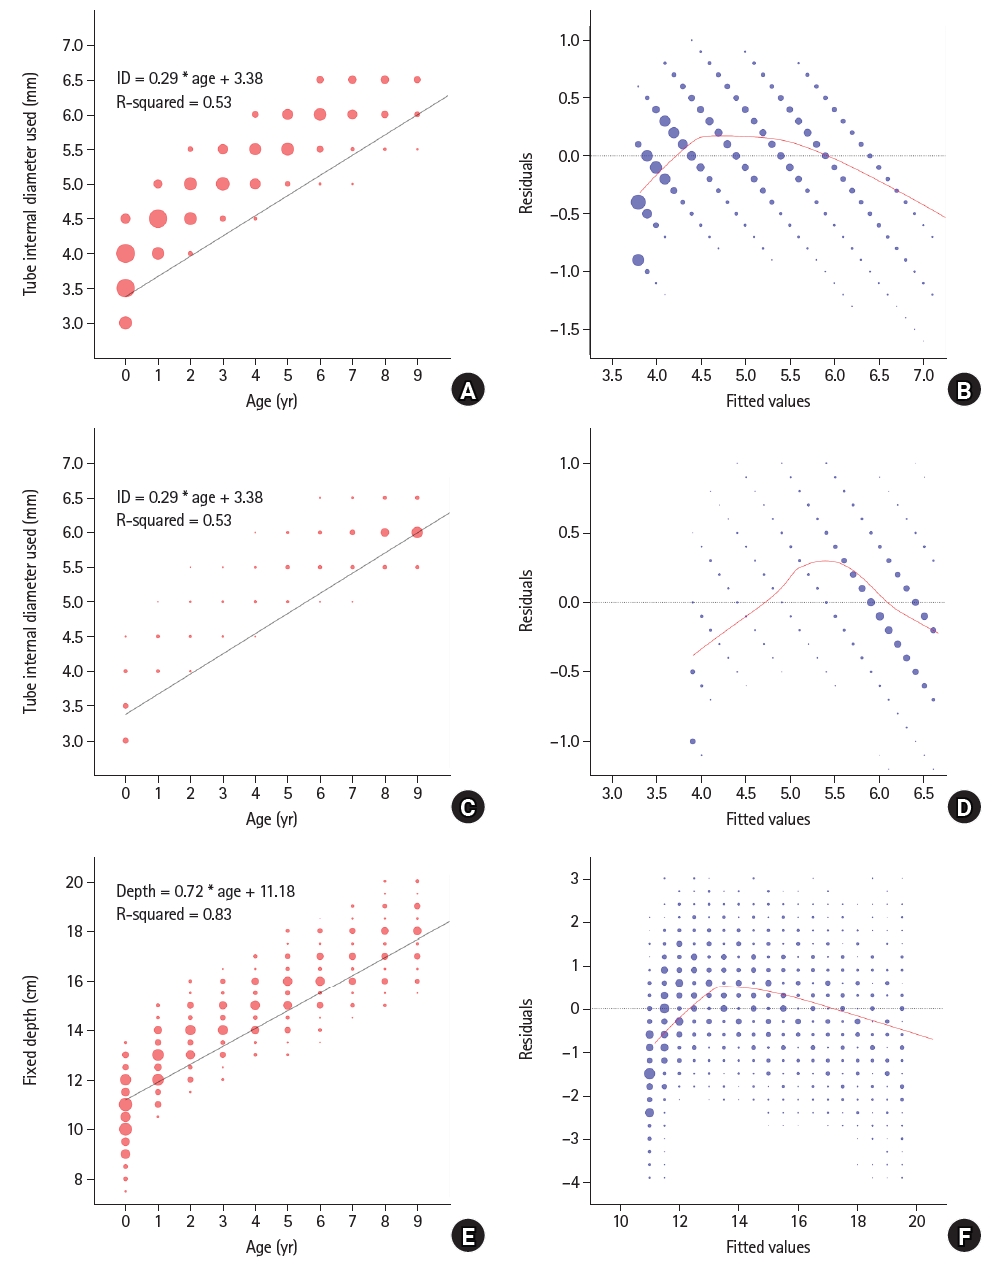
The linearity assumptions in the relationships between ETT size and depth with age were tested by verifying the normality of the residual distributions at a significance level of 0.05. The scatter plots of these variables and those of the residuals and fitted values were depicted to verify the linear relationship.
We adopted the Shapley additive explanation (SHAP) method to enhance the interpretability of the machine learning model. This method calculates the contribution of the input variables to the prediction and quantifies how each variable affects the output of the machine learning model [20].
To enhance the limited intuitive understanding of machine learning outcomes, we constructed a table presenting predictions for tube size using the GBRT model. This table was created by referencing the pediatric growth chart offered by the Korea Disease Control and Prevention Agency [21]. We incorporated weight and height data corresponding to the 5th, 15th, 25th, 50th, 75th, 85th, and 95th percentiles for each age from the pediatric growth chart.
We have released our data, model parameters, and code in a public repository (https://github.com/Hyeonsik/endotracheal_tube.git) and developed a web-based calculator (https://tubesize.net) to validate and apply the results.
Subgroup analysis
We performed a subgroup analysis of our predictive model for ETT size according to age. The patient population was stratified into three distinct age groups: neonates (< 1 month), infants (< 1 year), and others (≥ 1 year). Subsequently, we assessed and compared the predictive performance with the trained GBRT model within these subgroups without retraining.
Statistical analysis
Continuous variables, such as age, weight, and height, are presented as means (standard deviation) or medians (Q1, Q3), depending on the results of the Shapiro–Wilk test. Categorical variables, such as sex and ETT type, are presented numerically (percentages). Model performances were computed with a 95% CI through bootstrapping methods, and ml-stat-util (https://github.com/mateuszbuda/ml-stat-util) was employed for conducting statistical tests. The Mood’s median test was performed for model comparisons in the subgroup analysis. The Mann-Whitney U test or two-sample t-test was performed to compare continuous variables depending on the Shapiro–Wilk test results. For the comparison of categorical variables, the chi-square test was performed. Considering the two outcomes (size and depth) and two tube types (cuffed and uncuffed), a P value < 0.0125 was considered statistically significant after the Bonferroni correction.
A custom program was developed using Python® (Python Software Foundation, USA) with scikit-learn 1.0.2, XGBoost 1.7.3, Keras 2.7.0, SHAP 0.41.0, BorutaSHAP 1.1, and stat-util libraries, to develop and validate the model.
Results
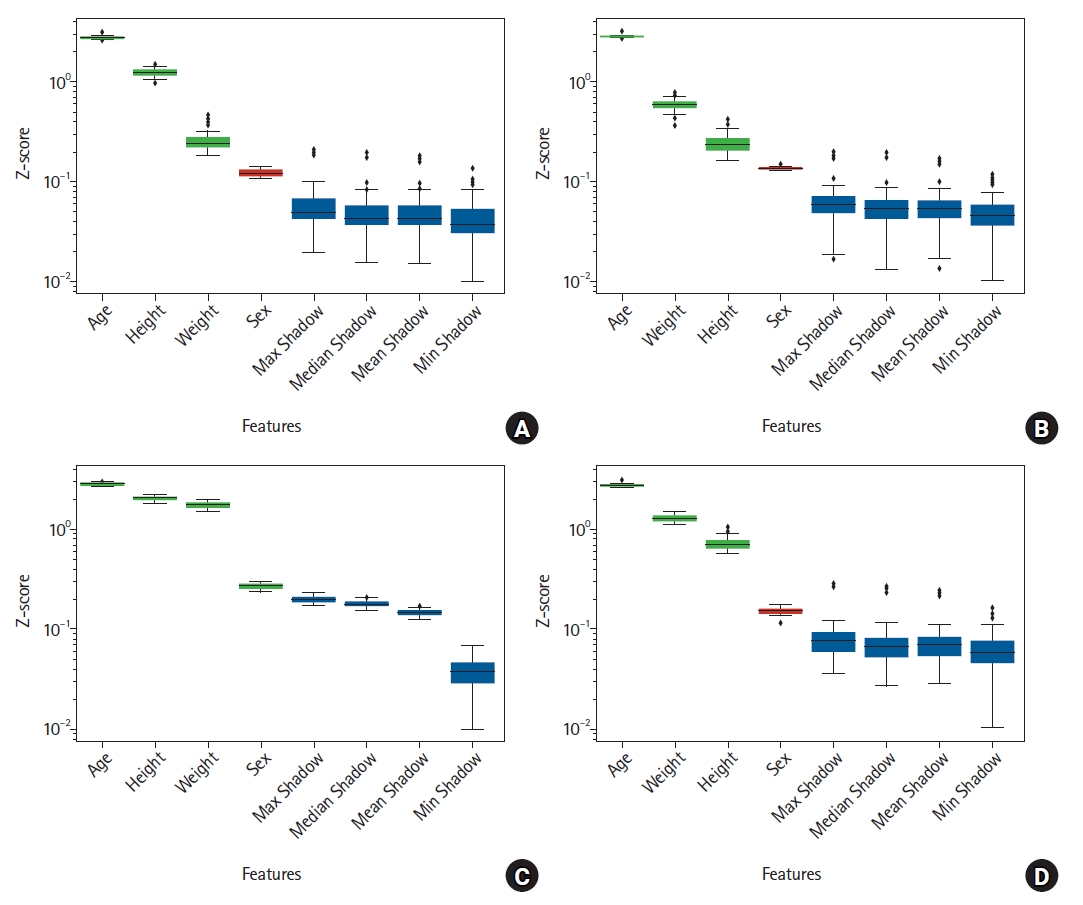
After excluding 114,594 patients, the final analysis included 37,057 surgical procedures (Fig. 1). The general characteristics of the data are summarized in Table 1. There were differences in age, height, weight, and the distribution of tube depth between training and test sets for both cuffed and uncuffed ETT data. The BorutaSHAP method was employed to identify significant input variables for the size and depth models, and the variable ‘sex’ was removed, except for the model predicting the depth of uncuffed ETTs, as they did not significantly affect the output (P < 0.05, Fig. 2). The results showed that age, weight, and height are critical factors in predicting ETT size and cuffed ETT depth. By contrast, age, sex, weight, and height are critical factors in predicting uncuffed ETT depth. Scatter plots depicting ETT size and depth by age and scatter plots depicting the residuals and fitted values are shown in Fig. 3. The linearity assumption between ETT size and age was not achieved (P < 0.001).
The GBRT model showed the highest macro-averaged F1 score of 0.502 (95% CI [0.486, 0.568]) in predicting the size of uncuffed ETTs and 0.669 (95% CI [0.640, 0.694]) for cuffed ETTs. This performance was superior to that of traditional age-based formulae that achieved a macro-averaged F1 score of 0.163 (95% CI [0.140, 0.196], P < 0.001) for uncuffed ETTs and 0.392 (95% CI [0.378, 0.406], P < 0.001) for cuffed ETTs (Table 2).
The GBRT model achieved the best performance in predicting the ETT depth, with an MAE of 0.71 cm (95% CI [0.69, 0.72]) for uncuffed ETTs and 0.72 cm (95% CI [0.70, 0.75]) for cuffed ETTs. The GBRT model outperformed the traditional age-based formula (MAE for uncuffed ETTs = 1.18 cm [95% CI 1.16, 1.20], MAE for cuffed ETTs = 1.34 cm [95% CI 1.31, 1.38]). There was a significant performance difference between the GBRT model and the traditional age-based formula (P < 0.001) (Table 3).
In the subgroup analysis, the size model showed the highest macro-averaged F1 score in the infant group for uncuffed ETTs and the other groups for cuffed ETTs, while the other groups showed the lowest accuracy for both uncuffed and cuffed ETT sizing (Table 4).
The tube sizes and depths predicted by the GBRT model for the representative demographic values are presented in Supplementary Table 2.
The SHAP summary plot in Supplementary Fig. 1 illustrates the contribution of each input variable to the output of the GBRT model. Older age, uncuffed ETT, heavier weight, and taller height contributed to larger ETT size. Older age, heavier weight, taller height, and male sex were associated with deeper ETT depth. The SHAP dependence plots presented in Supplementary Fig. 2 and Supplementary Fig. 3 illustrate the effect of each input variable on the prediction.
Discussion
In this study, we developed and validated machine learning models to predict the optimal ETT size and depth in pediatric patients. Our models used only demographic variables and considered the GBRT algorithm. The developed models outperformed the traditional age-based formulae.
Previous studies on optimal ETT size using age-based formulae have reported an accuracy in the range of 15%–50% in predicting the exact uncuffed or cuffed ETT size [9,10,14,16]. However, our model exhibited an accuracy of 58.2% and 70.1% for exact matching and 98.1% and 99.5% for an accuracy within 0.5 mm for uncuffed and cuffed ETTs, respectively. The differences in performance might be attributable to the use of machine learning algorithms that can model nonlinear relationships. The linearity test results and SHAP dependency plot in our study confirmed the nonlinear relationship between the size or depth of the ETT and age.
Other demographic variables, such as height and weight, also contributed significantly to improving the prediction of ETT size and depth. In the analysis based on the BorutaSHAP method, all variables, except for sex, were included in the GBRT model for predicting the ETT size. Therefore, adding these variables significantly improves model performance. These results are consistent with previous findings stating that there was no difference in terms of sex in developing the trachea throughout childhood [22]. Moreover, sex was only included in the GBRT model for predicting the depth of uncuffed ETTs. The uncuffed tube depth may be affected by sex owing to the difference in tongue size, as the ETT depth was measured at the lip corner.
In a previous study, Zhou et al. [16] developed machine learning models using demographic data and extracted features from the chest X-ray images of 990 patients to estimate the ETT size. The accuracies of their models were 57.5% and 52.3% for cuffed and uncuffed ETTs, respectively, whereas our model using only demographic data yielded accuracies of 70.1% and 58.2%, respectively. This difference can be attributed to the massive volume of data we used that was 25 times more than that used by Zhou et al.
Although Cole’s formula has been used in clinical practice for several decades, several studies have reported that Penlington’s formula is more accurate for predicting uncuffed ETT size [10,16]. Our study also found that Penlington’s formula that suggests a larger ETT size was more accurate than Cole’s formula in predicting uncuffed ETTs in pediatric patients. This difference in accuracy may be attributed to variations in the growth curve in pediatric populations over time and race since Cole’s formula was first introduced in a North American pediatric population in 1957 [5]. Nevertheless, all age-based formulae investigated in this study were highly inaccurate compared to the machine learning models.
In our subgroup analysis, the accuracy of the ‘others’ group, consisting of individuals aged one year or older, in predicting the ETT size was the lowest among the three age groups. This may be because the trachea size in the neonate and infant groups was relatively uniform compared to those in the other age groups. The difference in performance among the age groups also indicated a nonlinear relationship between age and tube size.
The strength of our model is its readiness in clinical situations because it is available as a web calculator, and its code is available online. In most electronic medical record systems, height and weight information is obtained before surgery. Additionally, according to the BorutaSHAP results obtained in this study, this additional information is significant. Therefore, a system implemented with the proposed model to provide automated suggestions could be practical for determining a more accurate ETT size and fixation depth in pediatric patients.
Our study has a few limitations. First, because our study was retrospective, there may be inevitable biases, and the excluded or missing data could have affected the results. Therefore, future prospective validation is needed to address these issues with minimal data loss. Second, the generalizability of our study may be limited because it was conducted for an Asian population at a single institute. The different patterns in clinical practices may influence the machine learning model’s performance and limit its real-world applicability. Therefore, conducting external validation studies across multiple centers, encompassing diverse patient populations and clinical practices, is crucial to assess the robustness and reliability of the model’s performance before the application. Third, we might have missed some important input variables, such as congenital diseases that may further affect airway anatomy and result in size depth variations of the ETT [23,24]. Fourth, different cuff designs, such as Hi-Contour or TaperGuardTM (Medtronic, Ireland), could result in variations in the optimal tube size and depth. Therefore, the models may require retraining before applying them to different tube types using the corresponding data for each specific tube type. Fifth, although we utilized the minimal set of readily collectible demographic variables, additional input parameters, such as Mallampati classification or imaging data like X-rays and ultrasound images, can improve model performance. Sixth, the labeled ETT size and depth may not be optimal because there could be some tolerance for improper tube size and depth by the attending anesthetist based on auscultation. Additionally, there may be inaccuracies in the recorded tube depth because the fixed depth difference may be changed by the patient’s position, especially in neonates and infants.
In conclusion, we developed and validated an explainable machine learning model to precisely estimate the size and depth of an ETT in pediatric patients using only basic demographic data. Prospective validation is warranted to validate our results before integration into clinical practice.